

To master RCI to the extreme!! Sign of the return high and mBDSR
=================
【RCI Related】 Free indicators and free e-books from Blacksun
https://www.gogojungle.co.jp/finance/navi/articles/90181
=================
【Mastering RCI!! Trend Reversals, Buy-the-Dall at Dips, and Sell on Rallies】
Indicators that shine when combined with RCI【BODSOR・mBDSR】
and Methods / Case Studies (PDF) ★GogoJungle AWARD2020 winner★
https://www.gogojungle.co.jp/tools/indicators/11836
AUD/USD 4-hour chart
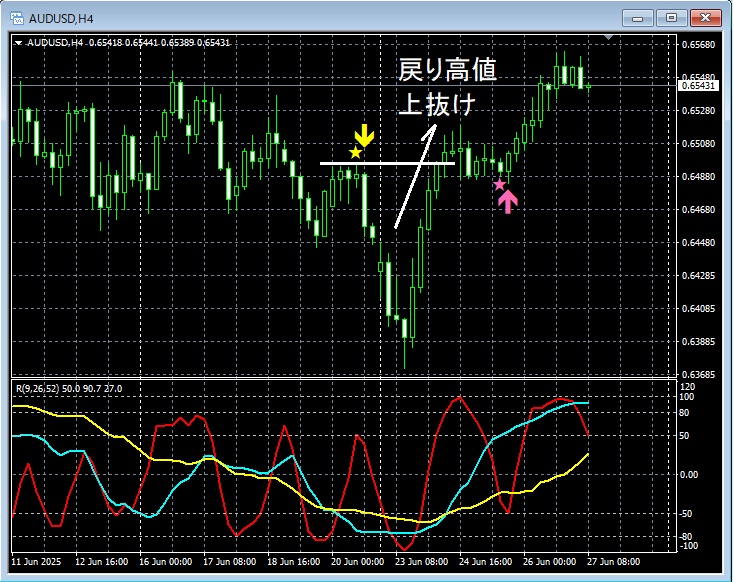
mBDSR (RCI two-filter)Signal
On the 4-hour chart above,the mBDSR (RCI two-filter) rally/long signallights up, and prices decline. Afterwards, reversing and rising.Break above the previous highthen declines again,the mBDSR pullback/buy signallights up, and prices continue to rise.
Indicators that shine when combined with RCI【BODSOR・mBDSR】
and Methods / Case Studies (PDF) ★GogoJungle AWARD2020 winner★
https://www.gogojungle.co.jp/tools/indicators/11836
More than 500 PDFs are included (Methods / Case Studies: over 1,850 pages, over 650,000 characters).
Most of them are about linking higher and lower timeframes logically using the three-line RCI, and examining multiple lower-timeframe conditions step by step, ultimately waiting for the timing of a pullback buy or rally sell on the lower timeframe signals (i.e., mBDSR).
Also,many focus on identifying points where multiple entry signals overlap.There are many sections like this.
Furthermore,there are methods that explore ascent and descent targets using the three-line RCI.Also included.
In the PDF explanations,more than 1,800 chartsare used.

=================
↓↓↓ Recommended free articles.
[Definitive Edition] USD/JPY Analysis Example
(RCI, candlestick patterns, moving averages, chart patterns, mBDSR, and R1R2S2 signals)
https://www.gogojungle.co.jp/finance/navi/articles/90838
=================
× ![]()


