

AUDJPY June 25, 2025 Rebound from the lower end of the range captured 【Master RCI to win extremely!!】
0
===============================
↓↓↓ This is a recommended free article.
[Preservation Version] USD/JPY Analysis Example
(Signals of RCI and candlestick patterns, moving averages, chart patterns, mBDSR, and R1R2S2)
https://www.gogojungle.co.jp/finance/navi/articles/90838
===============================
【Master RCI!! Trend Reversal, Buy on Dips, Sell on Rises】
A powerful indicator when combined with RCI: 【BODSOR・mBDSR】
and methods, case studies (PDF) ★GogoJungle AWARD2020 Winner★
https://www.gogojungle.co.jp/tools/indicators/11836
R1R2S2is included in the above product. For details, please see the investment Navi+ article below.
RCI three-line “two-stage decision” to target trend reversals, buy on dips, and sell on rallies – R1R2S2 released!!
(https://www.gogojungle.co.jp/finance/navi/articles/61588)
Also,R1R2S2is accompanied by PDFs (methods, case studies) added as needed. For details, please see the investment Navi+ article below.
PDF collection for effectively using R1R2S2【Master RCI to Win!!】
(https://www.gogojungle.co.jp/finance/navi/articles/93154)
Below,mBDSR (RCI two-line filter)andR1R2S2signs are shown simultaneously.
AUD/JPY 15-minute chart
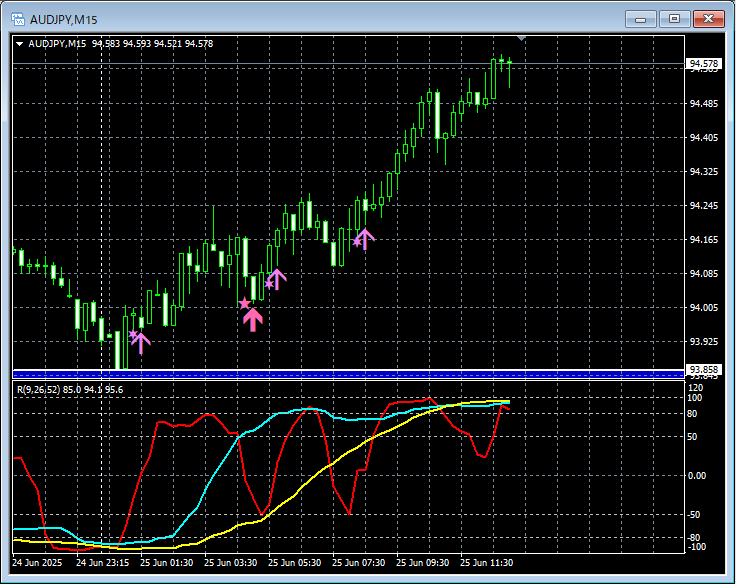
mBDSR (RCI two-line filter)andR1R2S2signs
In the above 15-minute chart, during a rebound from the lower range boundary,the buy-on-dip signal of mBDSR (RCI two-line filter)appeared once,the buy-on-dip signal of R1R2S2lit up three times, and the price rose steadily.
Using the RCI three-lineto drip down from higher to lower timeframes,wait for the lights of mBDSRto turn on,if the mBDSR signaldoes not turn on, or if you miss or are late to see it,the R1R2S2 signalmay be used to respond,R1R2S2isoften used in conjunction withmBDSR.
A powerful combination of indicators with RCI【BODSOR・mBDSR】
and methods, case studies (PDF) ★GogoJungle AWARD2020 Winner★
https://www.gogojungle.co.jp/tools/indicators/11836
The PDF file includes 358 documents (over 1,400 pages, over 470,000 words in total).
Many of these summarize examples where the upper-timeframe and lower-timeframe are logically linked using the three-line RCI, and ultimately designed to wait for the lower timeframe’s buy on dips or sell on rallies signals (i.e., mBDSR signals).
Also,many of these focus on capturing points where multiple entry reasons overlap.There are many such cases.
In addition,the method to explore price targets for rising or falling using the three-line RCIis also included.
In the PDF descriptions,more than 1,350 chartsare used.

× ![]()


