

Use both the sign of mBDSR (RCI2 band-pass filter) and the sign of R1R2S2 (32) Pound-Dollar 30-minute chart
0
=================
【RCI Related】Free Indicators and Free E-Books from Blacksun
https://www.gogojungle.co.jp/finance/navi/articles/90181
=================
【Master RCI!! Trend Reversal, Buying on Dips, Selling on Rallies】
Indicators【BODSOR・mBDSR】that work powerfully in combination with RCI
and Techniques & Case Studies (PDF) ★GogoJungle AWARD2020 Winner★
https://www.gogojungle.co.jp/tools/indicators/11836
R1R2S2is included in the above products. For details, please see the investment Navi+ articles below.
RCI3 lines ‘2-step confirmation’ to target Trend Reversal, Buying on Dips, and Selling on Rallies Indicator “R1R2S2” Release!!
(https://www.gogojungle.co.jp/finance/navi/articles/61588)
Also,R1R2S2is accompanied by PDFs (methods & case studies) added periodically. For details, please see the investment Navi+ articles below.
PDF collection for effectively using R1R2S2【Master RCI and Win!!】
(https://www.gogojungle.co.jp/finance/navi/articles/93154)
BelowmBDSR (RCI two-line filter)andR1R2S2signs shown simultaneously
GBPUSD 30-minute chart
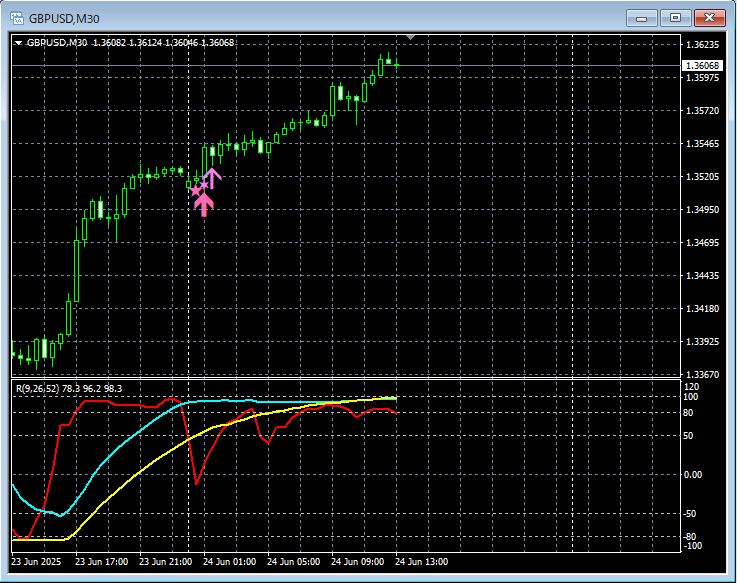
mBDSR (RCI two-line filter)andR1R2S2signs
In the above 30-minute chart, during an uptrendthe buy-the-dip signal of mBDSR (RCI two-line filter)→the buy-the-dip signal of R1R2S2lights up in sequence, and the price rises even further.
RCI Three-Linesare used to drill down from higher to lower timeframes,waiting for mBDSR signalsto light up,when the mBDSR signal does not light up or is missed or delayed,the R1R2S2 signalcan be used to respond,andR1R2S2is often used in conjunction withmBDSR.Indicators that shine with RCI synergy【BODSOR・mBDSR】and Techniques & Case Studies (PDF) ★GogoJungle AWARD2020 Winner★https://www.gogojungle.co.jp/tools/indicators/11836More than 550 PDFs included (methods & case studies: over 1,950 pages, over 690,000 words).Many of these areexamples that logically link higher and lower timeframes using the RCI three lines, and finally break them down to waiting for dips or pullbacks (i.e., mBDSR signals) on the lower timeframe..Also,many emphasize identifying points where multiple entry confirmations align..Additionally,there are methods for exploring upward or downward targets using the RCI three lines..In the PDF explanations,over 1,900 chartsare used.=================Blacksun Indicators (List)https://www.gogojungle.co.jp/finance/navi/articles/33779=================the R1R2S2 signalcan be used to respond,andR1R2S2is often used in conjunction withmBDSR.
Indicators that shine with RCI synergy【BODSOR・mBDSR】
and Techniques & Case Studies (PDF) ★GogoJungle AWARD2020 Winner★
https://www.gogojungle.co.jp/tools/indicators/11836
More than 550 PDFs included (methods & case studies: over 1,950 pages, over 690,000 words).
Many of these areexamples that logically link higher and lower timeframes using the RCI three lines, and finally break them down to waiting for dips or pullbacks (i.e., mBDSR signals) on the lower timeframe..
Also,many emphasize identifying points where multiple entry confirmations align..
Additionally,there are methods for exploring upward or downward targets using the RCI three lines..
In the PDF explanations,over 1,900 chartsare used.

=================
Blacksun Indicators (List)
https://www.gogojungle.co.jp/finance/navi/articles/33779
=================
× ![]()


