

[Master RCI to win extremely!!] Sign of mBDSR and the neck line
================================
↓↓↓ This is a recommended free article.
[Comprehensive Edition] USD/JPY Analysis Example
(Signals of RCI with candlestick patterns, moving averages, chart patterns, mBDSR and R1R2S2)
https://www.gogojungle.co.jp/finance/navi/articles/90838
================================
【Master RCI!! Trend Reversal, Buy on Dips, Sell on Rallies】
An indicator that shines in combination with RCI【BODSOR・mBDSR】
and methods, case studies (PDF) ★GogoJungle AWARD2020 winner★
https://www.gogojungle.co.jp/tools/indicators/11836
Canadian Dollar/Japanese Yen CADJPY 30-minute chart
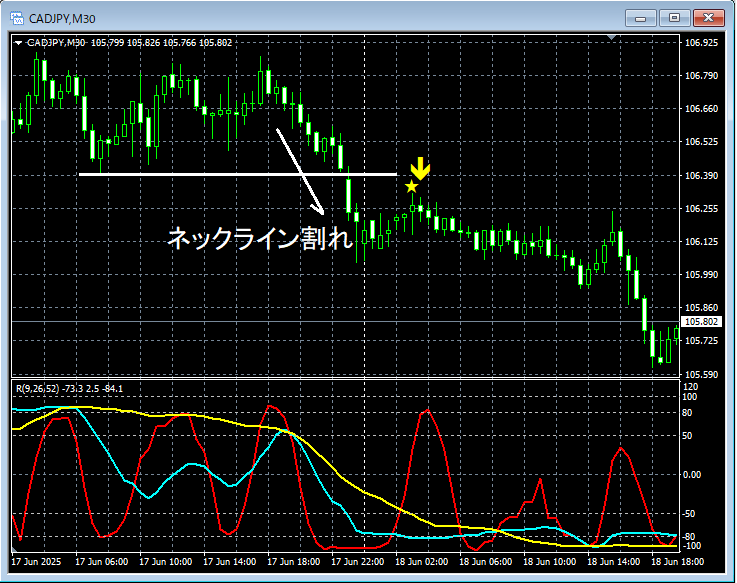
mBDSR (RCI two-line filter)signals
On the 15-minute chart above, as a resultneckline breakfollowed by a risemBDSR (RCI two-line filter) short entrance/sell signallights up, and prices have been dropping steadily ever since.
An indicator that shines in combination with RCI【BODSOR・mBDSR】
and methods, case studies (PDF) ★GogoJungle AWARD2020 winner★
https://www.gogojungle.co.jp/tools/indicators/11836
The PDF file includes 358 files (over 1,400 pages, over 470,000 characters in total).
Many of them areexamples that logically link higher and lower timeframes using the 3-line RCI, sequentially considering multiple lower-timeframe situations, and ultimately waiting for dip-buy signals or pullback-sell signals on the lower timeframes (i.e., mBDSR signals)..
Additionally,there are many that focus on identifying points where multiple entry reasons align..
Also included is a method for exploring upward and downward targets using the three-line RCI.
In the PDF explanations,more than 1,350 chartsare used.

× ![]()


