

Using both the sign of mBDSR (RCI2 bandpass filter) and the sign of R1R2S2 (31) Pound/Yen 5-minute chart
=================
【RCI Related】Free Indicators and Free E-Books from Blacksun
https://www.gogojungle.co.jp/finance/navi/articles/90181
=================
【Mastering RCI!! Trend Reversals, Dip Buying, and Rebound Selling】
Indicators that shine when used with RCI【BODSOR・mBDSR】
and Methodology / Case Studies (PDF) ★GogoJungle AWARD 2020 Winner★
https://www.gogojungle.co.jp/tools/indicators/11836
R1R2S2is included in the above-mentioned product. For details, please see the article below in the Investment Navi+.
RCI 3-line “Two-Stage Confirmation” Indicator to Target Trend Reversals, Dip Buying, and Rebound Selling: R1R2S2 Released!!
(https://www.gogojungle.co.jp/finance/navi/articles/61588)
Also,R1R2S2is complemented by PDFs (methodology & case studies) added as appropriate. For details, please see the article below in the Investment Navi+.
A Collection of PDFs to Effectively Utilize R1R2S2【Master RCI and Win!!】
(https://www.gogojungle.co.jp/finance/navi/articles/93154)
Below,mBDSR (RCI two-line filter)andR1R2S2signs are shown simultaneously as an example.
GBP/JPY 5-minute chart
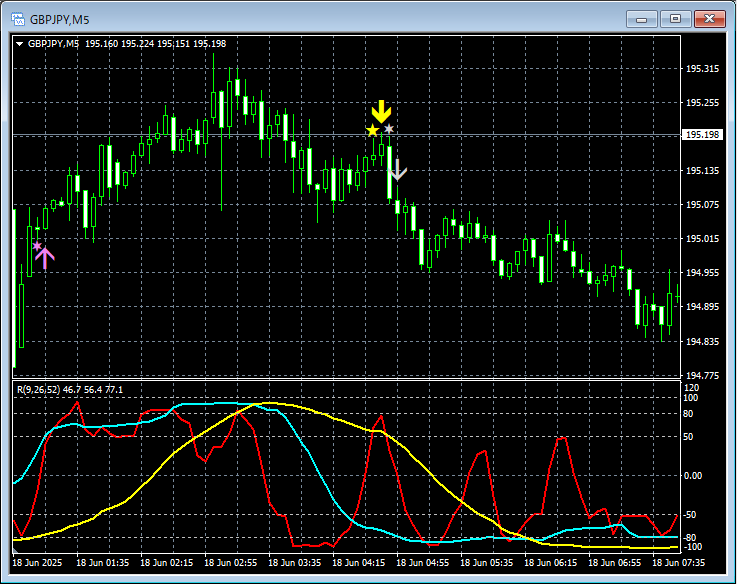
mBDSR (RCI two-line filter)andR1R2S2signs
On the above 5-minute chart,Dip-buying signal of R1R2S2lights up and price rises. Then it turns downward.Rebound-selling signal of mBDSR (RCI two-line filter)→Rebound-selling signal of R1R2S2lights up in order, and the price clearly declines.
RCI 3-lineis used to cascade from higher to lower timeframes,Waiting for mBDSR signalsto light up in a setup wheremBDSR signalsdid not light up, were overlooked, or were late,R1R2S2 signalscan sometimes be used to respond, andR1R2S2is often used in conjunction withmBDSR.
Indicators that shine when combined with RCI【BODSOR・mBDSR】
and Methodology / Case Studies (PDF) ★GogoJungle AWARD 2020 Winner★
https://www.gogojungle.co.jp/tools/indicators/11836
Over 550 PDF files (Methods & Case Studies: over 1,950 pages, over 690,000 words) are included.
Many of these arecollections that summarize how to logically link higher and lower timeframes using the RCI 3-line, gradually analyzing the conditions of multiple lower timeframes, and ultimately waiting for the timing of dip-buying or rebound selling on the lower timeframes (i.e., the mBDSR signal)..
Also,many entries emphasize identifying points where multiple entry reasons coincide..
In addition,there are methods that explore potential rise or fall targets using the RCI 3-line..
In the PDF explanations,more than 1,900 chartsare used.

=================
Blacksun Indicators (List)
https://www.gogojungle.co.jp/finance/navi/articles/33779
=================
× ![]()


