

Utilize both the sign of mBDSR (RCI2 Bandpass Filter) and the sign of R1R2S2 (30) USDCAD 5-minute chart
0
=================
【RCI Related】Free indicators and free eBooks from Blacksun
https://www.gogojungle.co.jp/finance/navi/articles/90181
=================
【Master RCI!! Trend Reversal, Buy on Dip, Sell on Rally】
An indicator that shines when combined with RCI【BODSOR・mBDSR】
and technique, and case studies (PDF) ★GogoJungle AWARD2020 winner★
https://www.gogojungle.co.jp/tools/indicators/11836
R1R2S2is included in the above products. For details, please read the following Invest Navi+ article.
RCI 3-line “Two-stage Confirmation” Indicator to Aim for Trend Reversal, Buy on Dip, Sell on Rally – R1R2S2 Released!!
(https://www.gogojungle.co.jp/finance/navi/articles/61588)
Also,R1R2S2is accompanied by PDFs (method & case studies) added as appropriate. For details, please read the following Invest Navi+ article.
PDF Collection to Make Full Use of R1R2S2【Mastering RCI and Winning!!】
(https://www.gogojungle.co.jp/finance/navi/articles/93154)
Below,mBDSR (RCI Two-Filter) andR1R2S2signs shown simultaneously are introduced.
US Dollar / Canadian Dollar USDCAD 5-minute chart
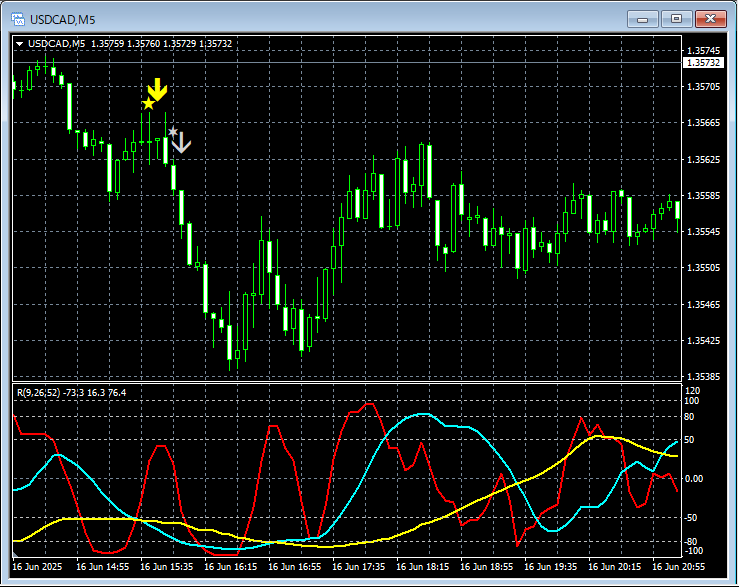
mBDSR (RCI Two-Filter)andR1R2S2
In the 5-minute chart above,mBDSR (RCI Two-Filter)’s Sell-Back sign→R1R2S2’s Sell-Back signlights up in order, and the price clearly moves lower.
Using the three RCI linesto drill down from higher to lower timeframes,wait for the mBDSR signto light up,when the mBDSR signdoes not light up or signs are missed or late,R1R2S2 signscan be used to respond,R1R2S2isoften used in conjunction withmBDSR.
Indicators that shine when combined with RCI【BODSOR・mBDSR】
and method & case studies (PDF) ★GogoJungle AWARD2020 winner★
https://www.gogojungle.co.jp/tools/indicators/11836
More than 550 PDF files (methods & case studies: over 1,950 pages, over 690,000 characters) are attached.
Many of these arecollections that logically link higher and lower timeframes using the RCI 3-line, sequentially considering multiple lower-timeframe situations, and ultimately waiting for the timing of dip-buying or rally-selling on the lower timeframe (i.e., the mBDSR signs).as examples.
Also,many focus on identifying points where multiple entry reasons overlap..
Additionally,there are methods to explore ascent targets and decline targets using the RCI 3-line..
In the PDF explanations,more than 1,900 chartsare used.

=================
↓↓↓ Recommended free articles.
【Master Copy】USD/JPY Analysis Example
(RCI and candlestick patterns and moving averages and chart patterns and mBDSR and R1R2S2 signs)
https://www.gogojungle.co.jp/finance/navi/articles/90838
=================
× ![]()


