

Utilize both the sign of mBDSR (RCI2 bandpass filter) and the sign of R1R2S2 (29) AUDUSD 15-minute chart (also pay attention to the double top)
0
=================
【RCI Related】 Free indicator and free e-books for Blacksun
https://www.gogojungle.co.jp/finance/navi/articles/90181
=================
【Mastering RCI!! Trend Reversal, Buy on Dips, Sell on Rallies】
Indicators that excel in combination with RCI【BODSOR・mBDSR】
and techniques and case studies (PDF) ★GogoJungle AWARD2020 winner★
https://www.gogojungle.co.jp/tools/indicators/11836
R1R2S2is included in the above products. For details, please read the following Investment Navi+ article.
RCI three-line “Two-stage Confirmation” to target trend reversals, buy on dips, and sell on rallies - R1R2S2 released!!
(https://www.gogojungle.co.jp/finance/navi/articles/61588)
Also,R1R2S2is accompanied by PDFs (methods and case studies) added as appropriate. For details, please read the following Investment Navi+ article.
PDF collection for effectively using R1R2S2【Master RCI and win!!】
(https://www.gogojungle.co.jp/finance/navi/articles/93154)
Below,mBDSR (RCI two-line filter)andR1R2S2signs are shown simultaneously as examples.
AUD/USD 15-minute chart
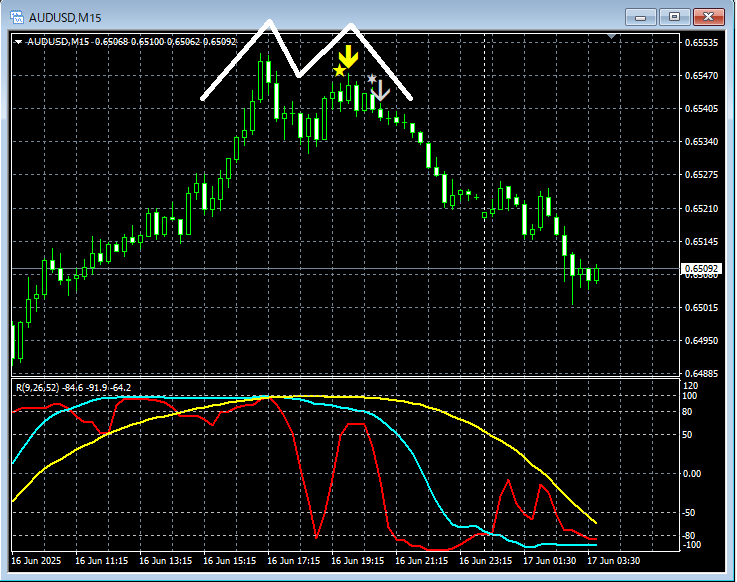
mBDSR (RCI two-line filter)andR1R2S2
On the 15-minute chart above,a double topis forming and the price is dropping. As a result,the right-hand peak of the double topproducesthe sell signal from mBDSR (RCI two-line filter)→the sell signal from R1R2S2lights up in sequence, and the price indeed declines.
RCI three-lineis used to drill down from higher time frames to lower time frames,waiting for the mBDSR signalto light up,and when the mBDSR signal does not light up, or is missed or late,the R1R2S2 signalmay be used to respond,and R1R2S2isoften used in conjunction withmBDSRand is frequently used together.Indicators that excel in combination with RCI【BODSOR・mBDSR】and techniques and case studies (PDF) ★GogoJungle AWARD2020 winner★https://www.gogojungle.co.jp/tools/indicators/11836More than 550 PDF files (techniques and case studies: over 1,950 pages, over 690,000 characters) are included.Many of these areexamples that logically link higher and lower time frames by using the RCI three-line, sequentially analyzing multiple lower-time-frame conditions, and finally waiting for a timing of buying on dips or selling on rallies (the mBDSR signals)..Also,many focus on identifying points where multiple entry bases coincide..In addition,there are methods that explore price targets for increases or decreases using the RCI three-line..In the PDF explanations,more than 1,900 chartsare used.=================↓↓↓ Recommended free articles.【Master Copy】 Dollar-Yen analysis example(RCI, candlestick patterns, moving averages, chart patterns, mBDSR, and R1R2S2 signals)https://www.gogojungle.co.jp/finance/navi/articles/90838=================the R1R2S2 signalmay be used to respond,and R1R2S2isoften used in conjunction withmBDSR
Indicators that excel in combination with RCI【BODSOR・mBDSR】
and techniques and case studies (PDF) ★GogoJungle AWARD2020 winner★
https://www.gogojungle.co.jp/tools/indicators/11836
More than 550 PDF files (techniques and case studies: over 1,950 pages, over 690,000 characters) are included.
Many of these areexamples that logically link higher and lower time frames by using the RCI three-line, sequentially analyzing multiple lower-time-frame conditions, and finally waiting for a timing of buying on dips or selling on rallies (the mBDSR signals)..
Also,many focus on identifying points where multiple entry bases coincide..
In addition,there are methods that explore price targets for increases or decreases using the RCI three-line..
In the PDF explanations,more than 1,900 chartsare used.

=================
↓↓↓ Recommended free articles.
【Master Copy】 Dollar-Yen analysis example
(RCI, candlestick patterns, moving averages, chart patterns, mBDSR, and R1R2S2 signals)
https://www.gogojungle.co.jp/finance/navi/articles/90838
=================
× ![]()


