

【Master RCI and Win!!】mBDSR’s signature and a double top
===============================
↓↓↓ This is a free recommended article.
[Comprehensive Edition] USD/JPY Analysis Example
(Signals of RCI and candlestick patterns, moving averages, chart patterns, mBDSR, and R1R2S2)
https://www.gogojungle.co.jp/finance/navi/articles/90838
===============================
【Mastering RCI!! Trend Reversal, Pullback Buying, and Selling on Rallies】
Indicator combination that shines with RCI: 【BODSOR・mBDSR】
and method, case studies (PDF) ★GogoJungle AWARD 2020 Winner★
https://www.gogojungle.co.jp/tools/indicators/11836
USD/CHF 15-minute chart
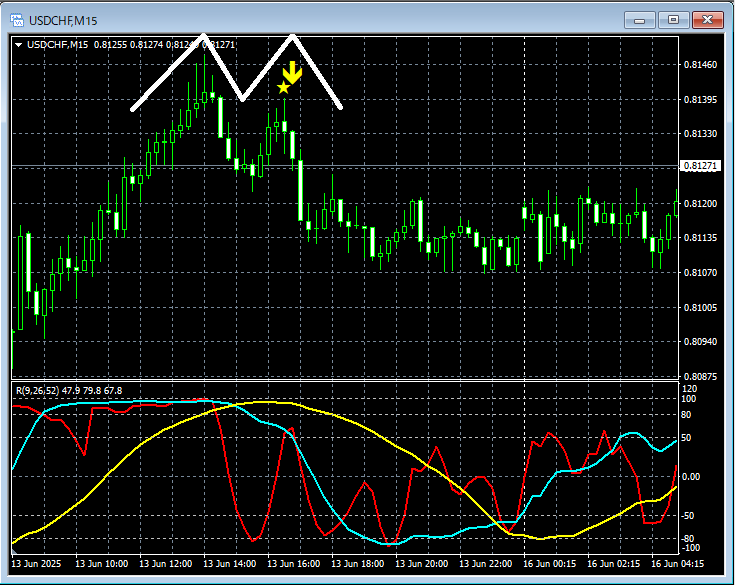
mBDSR (RCI two-line filter)Signal
On the 15-minute chart above, as a result,the timing of the price drop on the right side of the double topis well captured by the mBDSR (RCI two-line filter) short-sell signal. This is a very common pattern.
Indicator combination that shines with RCI: 【BODSOR・mBDSR】
and method, case studies (PDF) ★GogoJungle AWARD 2020 Winner★
https://www.gogojungle.co.jp/tools/indicators/11836
The PDF file includes 358 items (over 1,400 pages, over 470,000 words in total).
Many of them are aboutanalyzing multiple lower-timeframe conditions by logically linking higher and lower timeframes using the three-line RCI, and finally waiting for pullback buying or selling on rallies (i.e., the signals of mBDSR).This is summarized.
Also,there are many that emphasize identifying points where multiple entry reasons overlap.
Additionally,there is also a method that explores upward and downward targets using the three-line RCI.
In the explanations within the PDF files,more than 1,350 chartsare used.

× ![]()


