

Master RCI to the extreme!! Sign and Pin Bar of mBDSR
================================
↓↓↓ This is a recommended free article.
[For Reference] USD/JPY Analysis Example
(Signals of RCI and candlestick patterns with moving averages and chart patterns and mBDSR and R1R2S2)
https://www.gogojungle.co.jp/finance/navi/articles/90838
================================
【Mastering RCI!! Trend Reversal, Buy the Dip, Sell the Rally】
Indicator that shines when used together with RCI【BODSOR・mBDSR】
and methods / case studies (PDF) ★GogoJungle AWARD2020 Winner★
https://www.gogojungle.co.jp/tools/indicators/11836
NZDUSD 15-minute chart
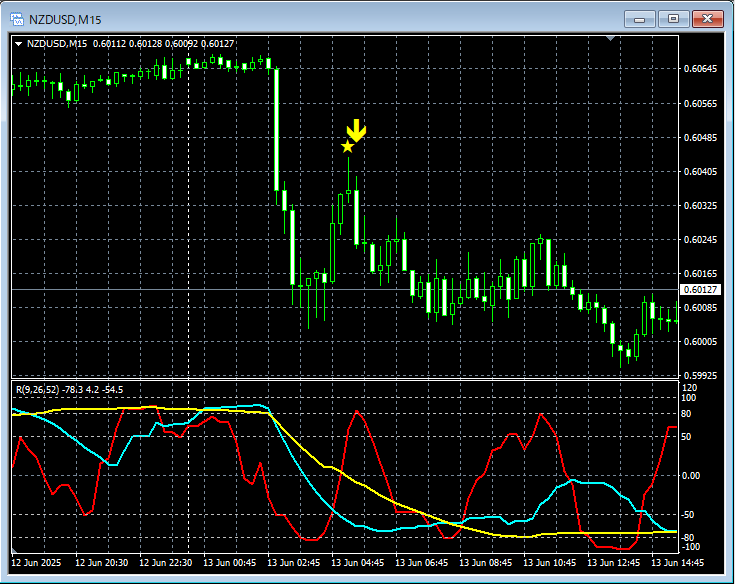
mBDSR (RCI two-line filter)signal
In the upper 15-minute chart,the sell-off signal of the mBDSR (RCI two-line filter)indicates a descent just before it lights upa long upper wick pin barappears.
Using the RCI three-line spreadto drill down from higher timeframes to lower timeframesthe mBDSR signaland wait for its activation, in such a context a candlestick pattern suggesting further decline appears, providing one more basis for entry.
Indicator that shines when used together with RCI【BODSOR・mBDSR】
and methods / case studies (PDF) ★GogoJungle AWARD2020 Winner★
https://www.gogojungle.co.jp/tools/indicators/11836
The PDF file includes 358 items (over 1,400 pages, over 470,000 characters).
Many of them are designed to logically link higher and lower timeframes using the three-line RCI, examining multiple lower-timeframe conditions sequentially, and ultimately drilling down to a setup that waits for a dip-buy or pullback timing (the mBDSR signal).

× ![]()


