

【Last Friday's GBPCAD 15-minute chart】Sign of R1R2S2 using two-stage RCI determination 2025/6/15
==============================
↓↓↓ This is a recommended free article.
[Preserved Edition] USD/JPY Analysis Example
(Signals of RCI and candlestick patterns, moving averages, chart patterns, mBDSR, and R1R2S2)
https://www.gogojungle.co.jp/finance/navi/articles/90838
==============================
[Mastering RCI!! Trend Reversal, Buy on Dips, Sell on Rallies]
An indicator that is powerful when combined with RCI: [BODSOR・mBDSR]
and methods, case studies (PDF) ★GogoJungle AWARD2020 Winner★
https://www.gogojungle.co.jp/tools/indicators/11836
R1R2S2is included in the above product. For details, please read the investment navigation + article below.
RCI three lines 'two-stage confirmation' to target trend reversal, buying on dips, and selling on rallies — R1R2S2 released!!
Below,R1R2S2signal examples will be introduced.
British Pound / Canadian Dollar GBPCAD Five-minute Chart
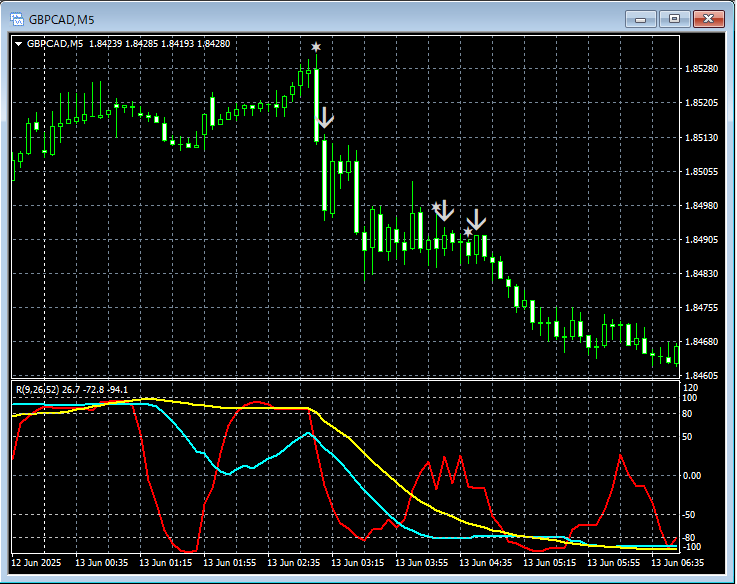
R1R2S2Signal
On the above 5-minute chart, the R1R2S2 sell-on-rally signal lights up three times at well-timed points.
Using the three RCI linesto map from higher to lower timeframes,waiting for mBDSR signalsto light up,if the mBDSR signal does not light up, or you overlook or are late to it,the R1R2S2 signalcan be used in some cases,in conjunction withmBDSRin many cases.
Also,R1R2S2was updated with a new version yesterday (June 14, 2025). For details, please see the investment navigation + below.
【About the R1R2S2 Version Update】
The indicator [BODSOR・mBDSR], which is powerful in combination with RCI
and methods, case studies (PDF) ★GogoJungle AWARD2020 Winner★
https://www.gogojungle.co.jp/tools/indicators/11836
The PDF file includes 358 items (over 1,400 pages, over 470,000 characters).
Many of theseprovide examples that logically link higher and lower timeframes using the RCI three-line method, leading to examining multiple lower-timeframe conditions step by step, and ultimately waiting for dip-buying or rally-selling timing (i.e., mBDSR signal) on the lower timeframe..
Additionally,many focus on identifying points where multiple entry rationales coincide..
Also,there are methods that explore upside/downside targets using the RCI three lines..
In the PDF explanations,more than 1,350 chartsare used.

× ![]()


