

Master RCI to the extreme!! Use both signals of mBDSR (Moving Average Filter) and R1R2S2 (3) Euro AUD EURAUD
0
=======================================
【RCI Related】 Free indicators and free e-books from Blacksun
https://www.gogojungle.co.jp/finance/navi/articles/90181
=======================================
【Mastering RCI!! Trend Reversal, Buy the Dip, Sell on Retracements】
Indicators that excel in combination with RCI: 【BODSOR・mBDSR】
and Methods / Case Studies (PDF) ★GogoJungle AWARD 2020 winning★
https://www.gogojungle.co.jp/tools/indicators/11836
R1R2S2is included in the above products. For details, please see the article below on Investment Navi+.
RCI 3-line “Two-stage Confirmation” Indicator to Target Trend Reversals, Dip Buys, and Retracements: R1R2S2 Release!!
(https://www.gogojungle.co.jp/finance/navi/articles/61588)
Additionally,R1R2S2is supported by PDF (methods / case studies) added as needed. For details, please see the article below on Investment Navi+.
PDF collection for effectively utilizing R1R2S2【Master RCI to Win!!】
(https://www.gogojungle.co.jp/finance/navi/articles/93154)
Below we introducemBDSR (Moving Average Filter)andR1R2S2signs displayed simultaneously as an example.
Euro-Oz CAD EURAUD 30-minute chart
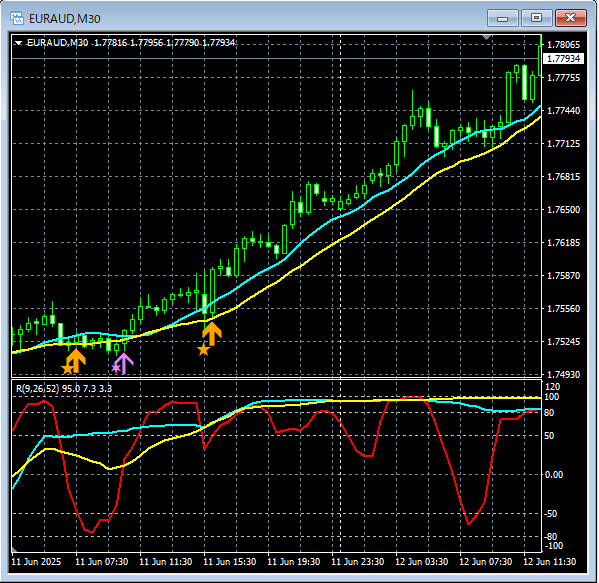
mBDSR (MA 2-Filter)andR1R2S2
On the 30-minute chart above,mBDSR (MA 2-filter) dip-buy signal→R1R2S2 dip-buy signal→mBDSR (MA 2-filter) dip-buy signalin that order, with a rising price.
Using the RCI 3-lineto roll down from higher timeframes to lower timeframesmBDSR signalsand wait for the signal to light up,mBDSR signalnot lighting up, missing the signal, or late entry can be addressed byR1R2S2 signalin some cases,R1R2S2isoften used in conjunction withmBDSR.
Indicators that shine when combined with RCI【BODSOR・mBDSR】
and methods / case studies (PDF) ★GogoJungle AWARD 2020★
https://www.gogojungle.co.jp/tools/indicators/11836
There are over 550 PDF files (methods / case studies: over 1,950 pages, over 690,000 characters) attached.
Many of them are compiled from examples that logically link higher and lower timeframes using the RCI 3-line, then consider multiple lower timeframes sequentially, and ultimately wait for a dip buy or a retracement timing (the mBDSR signal) on the lower timeframe.
Also,many focus on capturing points where multiple entry reasons align.There are also many that include methods for exploring upside and downside targets using the RCI 3-line.
In the PDF explanations,more than 1,900 charts
are used.

=======================================
↓↓↓ Recommended free articles.
【Master Archive】 Dollar/Yen Analysis Example
(RCI and candlestick patterns with moving averages and chart patterns and mBDSR and R1R2S2 signals)
https://www.gogojungle.co.jp/finance/navi/articles/90838
=======================================
× ![]()


