

Use both the sign of mBDSR (RCI2 bandpass filter) and the sign of R1R2S2 (28) Crude Oil WTI 4-hour chart
0
=================
【RCI Related】Free indicators by Blacksun and Free eBooks
https://www.gogojungle.co.jp/finance/navi/articles/90181
=================
【Mastering RCI!! Trend Reversal, Buy-on-Dip, and Selling on Rallies】
Indicator that shines in combination with RCI: 【BODSOR・mBDSR】
Methods and case studies (PDF) ★Awarded GogoJungle AWARD 2020★
https://www.gogojungle.co.jp/tools/indicators/11836
R1R2S2is included in the above products. For details, please see the article below in the Investment Navi+.
RCI 3-line “Two-Stage Judgment” to target trend reversals, buy-on-dip, and rally selling: Release of the indicator “R1R2S2”!!
(https://www.gogojungle.co.jp/finance/navi/articles/61588)
Also,R1R2S2PDFs (methods and case studies) are added as needed to help you use it effectively. For details, please see the article below in the Investment Navi+.
PDF collection to effectively utilize R1R2S2【Master RCI and Win!!】
(https://www.gogojungle.co.jp/finance/navi/articles/93154)
Below,mBDSR (Two-Filter RCI) andR1R2S2signs shown simultaneously are introduced in example.
Crude Oil WTI 4-hour chart
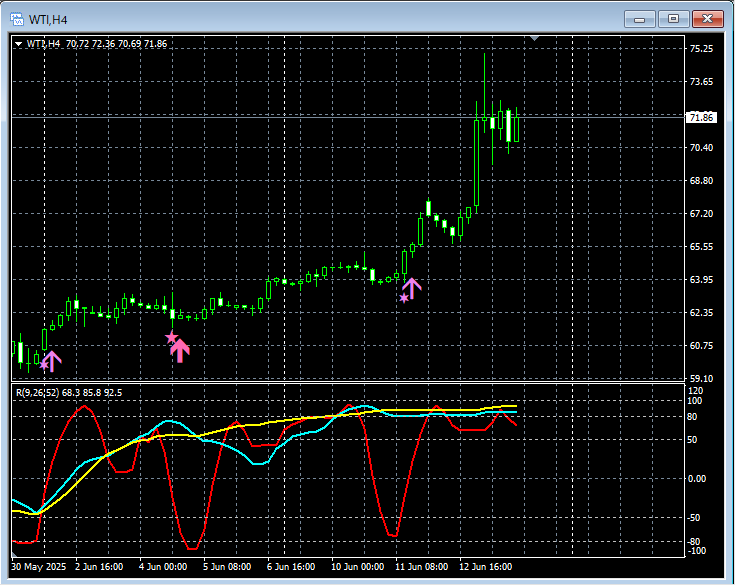
mBDSR (Two-Filter RCI)andR1R2S2sign
On the 4-hour chart above,R1R2S2 Buy-on-Dip signal→mBDSR (Two-Filter RCIs) Buy-on-Dip signal→R1R2S2 Buy-on-Dip signallights up in sequence, and price clearly rises.
Using the three RCI linesto map from higher to lower timeframes,wait for the signals of mBDSRto illuminate, thenif the mBDSR signal does not illuminate, or you miss it or are late,there are cases where the R1R2S2 signal can be used, andR1R2S2is often used in conjunction withmBDSR.
Indicator that shines in combination with RCI【BODSOR・mBDSR】
Methods and case studies (PDF) ★Awarded GogoJungle AWARD 2020★
https://www.gogojungle.co.jp/tools/indicators/11836
There are more than 550 PDF files (methods and case studies: over 1,950 pages, over 690,000 words).
Many of them are designed to logically link higher and lower timeframes with the RCI 3-line, progressively analyzing multiple lower-timeframe conditions, and ultimately waiting for the timing of a dip buy or rally sell on the lower timeframe (i.e., the mBDSR signal).
Also,many focus on identifying points where multiple entry reasons overlap.There are also many that include methods to explore upward and downward targets using the RCI 3-line.
In the PDF explanations,
over 1,900 chartsare used.

=================
↓↓↓ Recommended free articles.
【Complete Edition】USD/JPY Analysis Example
(Signals of RCI, candlesticks patterns, moving averages, chart patterns, mBDSR, and R1R2S2)
https://www.gogojungle.co.jp/finance/navi/articles/90838
=================
× ![]()


