

[Recent Crude Oil Daily and 4-Hour Chart] R1R2S2 Signals Using Two-Stage RCI Judgment WTI
================================
↓↓↓ This is a recommended free article.
[Comprehensive Edition] USD/JPY Analysis Example
(Signals of RCI, candlestick patterns, moving averages, chart patterns, mBDSR and R1R2S2)
https://www.gogojungle.co.jp/finance/navi/articles/90838
================================
[Mastering RCI!! Trend Reversal, Buy on Dips, Sell on Rallies]
An indicator that shines when combined with RCI: [BODSOR・mBDSR]
Methods & Case Studies (PDF) ★GogoJungle AWARD2020 Winner★
https://www.gogojungle.co.jp/tools/indicators/11836
R1R2S2is included in the above product. For details, please see the article below on Investment Navi+.
RCI 3-line “2-stage confirmation” to target trend reversal, buying dips, and selling rallies – Release of indicator “R1R2S2”
Below,R1R2S2sign examples are introduced.
Crude Oil WTI Daily
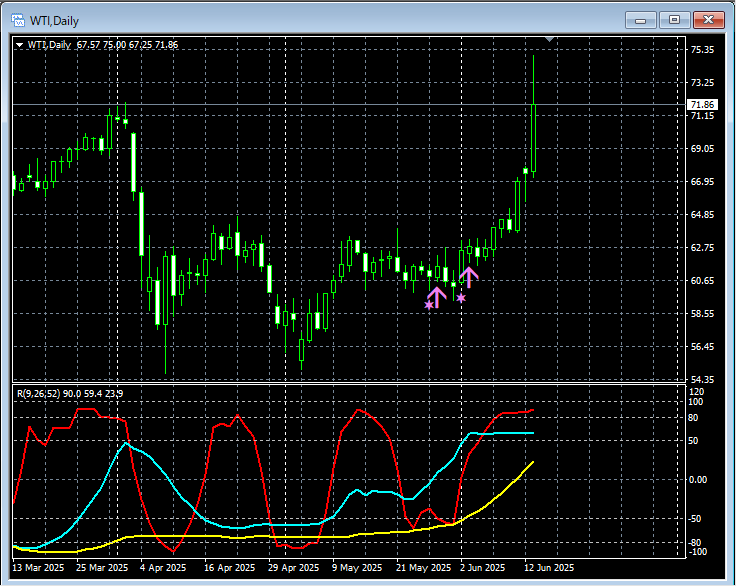
R1R2S2signs
Crude Oil WTI 4-hour
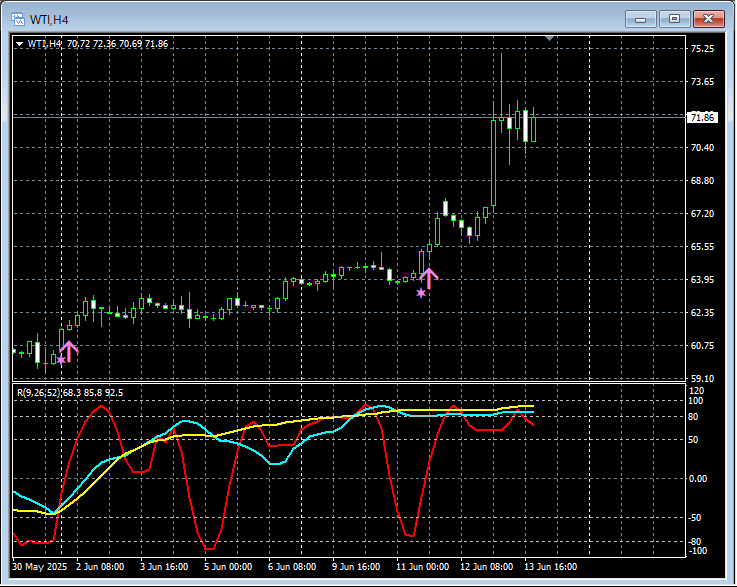
R1R2S2sign
On the daily and 4-hour charts above,R1R2S2dip-buy signals light up twice in a timely manner.
Using the RCI 3-lineto drill down from higher to lower timeframes,mBDSR signalsare brought to light,whenthe mBDSR signal does not light up, or you miss or are late to the signal,R1R2S2can sometimes be used to respond,R1R2S2is often used in conjunction withmBDSR.
Also,R1R2S2received a version upgrade yesterday (June 14, 2025). For details, see the Investment Navi+ below.
About the version upgrade of 【R1R2S2】
The indicator [BODSOR・mBDSR], which shines when combined with RCI
and methods & case studies (PDF) ★GogoJungle AWARD2020 Winner★
https://www.gogojungle.co.jp/tools/indicators/11836
The PDF file includes 358 files (over 1,400 pages, over 470,000 characters).
Most of them are examples outlining a workflow where the RCI 3-line links the higher and lower timeframes logically, iterating through multiple lower-timeframe scenarios, and ultimately waiting for a dip-buy or a rally-sell timing (i.e., the mBDSR signal) on the lower timeframe.

× ![]()


