

[Yesterday's Bitcoin 5-minute chart] RCI two-filtered mBDSR signal BTCUSD
================================
↓↓↓ This is a free recommended article.
[Comprehensive Edition] USD/JPY Analysis Example
(Signals of RCI and candlestick patterns, moving averages, chart patterns, mBDSR, and R1R2S2)
https://www.gogojungle.co.jp/finance/navi/articles/90838
================================
[Mastering RCI!! Trend Reversal, Buy-the-Dip, Sell-the-Rally]
Indicators that excel when combined with RCI: [BODSOR・mBDSR]
Methods and case studies (PDF) ★GogoJungle AWARD2020 Winner★
https://www.gogojungle.co.jp/tools/indicators/11836
Bitcoin/USD BTCUSD 5-minute chart
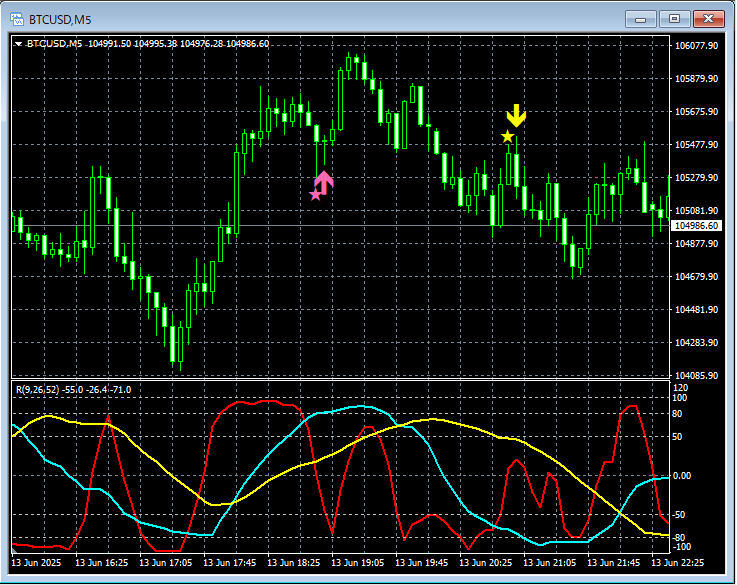
mBDSR (RCI two-lines filter)Signal
In the 5-minute chart above,mBDSR (RCI two-lines filter)Buy-the-dip signal and sell-the-rally signal light up in a timely manner.
Indicators that excel when combined with RCI: [BODSOR・mBDSR]
Methods and case studies (PDF) ★GogoJungle AWARD2020 Winner★
https://www.gogojungle.co.jp/tools/indicators/11836
The PDF file includes 358 files (over 1,400 pages, over 470,000 characters in total).
Many of them areexamples that logically link higher and lower timeframes using the three RCI lines, examining multiple lower-timeframe conditions step by step, and ultimately waiting for a dip-buy or rally-sell timing (i.e., the signals of mBDSR) on the lower timeframes.
Additionally,many focus on identifying points where multiple entry reasons coincide.
Furthermore,it also includes a method to explore upside and downside targets using three RCI lines..
In the PDF descriptions,more than 1,350 chartsare used.

× ![]()


