

[Yesterday's Nikkei 225 5-minute chart] RCI two-stage decision using R1R2S2 signal
===============================
↓↓↓ This is a recommended free article.
[Preserved Edition] USD/JPY Analysis Example
(Signals of RCI and candlestick patterns, moving averages, chart patterns, mBDSR, and R1R2S2)
https://www.gogojungle.co.jp/finance/navi/articles/90838
===============================
[Mastering RCI!! Trend Reversal, Buy on Dips, Sell on Rallies]
Indicator that shines in combination with RCI【BODSOR・mBDSR】
and methods/case studies (PDF) ★GogoJungle AWARD2020 Winner★
https://www.gogojungle.co.jp/tools/indicators/11836
R1R2S2is included in the above product. For details, please see the following Investment Navigator+ article.
RCI 3-line “2-step confirmation” to target trend reversals, buy on dips, and sell on rallies – R1R2S2 released!!
Below,R1R2S2sign examples are introduced.
Nikkei 225 JP225 5-minute chart
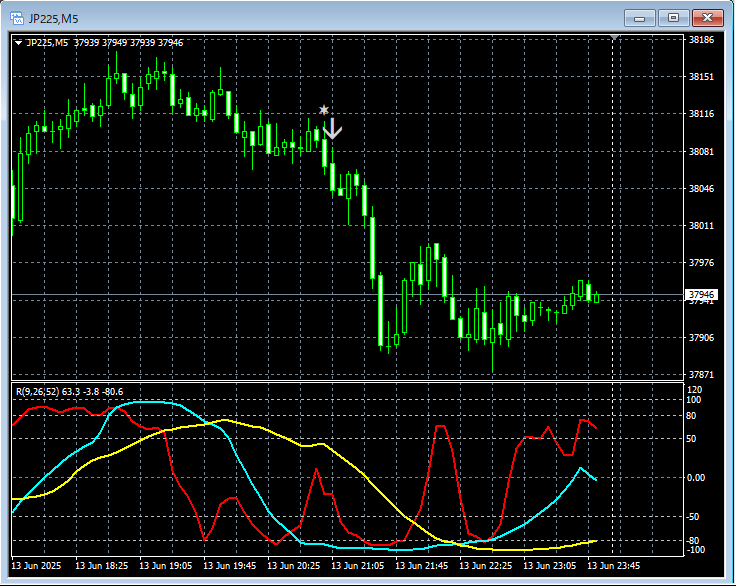
R1R2S2signs
In the above 5-minute chart,R1R2S2reversal-sell signals light up in a timely manner.
Using the RCI 3-lineto drill down from higher to lower timeframes,wait for the mBDSR signalsto illuminate,if the mBDSR signals do not light up, or you miss or are late to see them,it may be possible to respond with the R1R2S2 signals,R1R2S2is often used in conjunction withmBDSR.
Note,R1R2S2has been updated today (June 14, 2025). For details, please see the following Investment Navigator+ article.
About the updated version of 【R1R2S2】
Indiator that shines in combination with RCI【BODSOR・mBDSR】
and methods/case studies (PDF) ★GogoJungle AWARD2020 Winner★
https://www.gogojungle.co.jp/tools/indicators/11836
The PDF file includes 358 files (over 1,400 pages, over 470,000 characters).
Many of them areexamples that logically link higher and lower timeframes using the RCI 3-line to sequentially examine multiple lower timeframes and finally wait for the timing of dips or rallies (i.e., mBDSR signals) on the lower timeframe.
Also,many of them emphasize identifying points where multiple entry reasons overlap.
Additionally,there are also methods to explore upside/downside targets using RCI 3-line.
In the PDF explanations,over 1,350 chartsare used.

× ![]()


