

【Yesterday's USDCAD 15-minute chart】Sign of R1R2S2 using two-step RCI判定
================================
↓↓↓ This is a recommended free article.
[Comprehensive Edition] USD/JPY Analysis Example
(Signs of RCI, candlestick patterns, moving averages, chart patterns, mBDSR, and R1R2S2)
https://www.gogojungle.co.jp/finance/navi/articles/90838
================================
[Master RCI!! Trend Reversal, Buy on Pullbacks, Sell on Rallies]
Indicator that shines in combination with RCI: [BODSOR・mBDSR]
Methods and Case Studies (PDF) ★GogoJungle AWARD2020 Winner★
https://www.gogojungle.co.jp/tools/indicators/11836
R1R2S2is included in the above product. For details, please see the investment navigator article below.
RCI 3-line “Two-stage Confirmation” to target trend reversal, pullbacks, and rallies with the indicator “R1R2S2” released!!
Below, we紹介 the signs examples ofR1R2S2.
US Dollar / Canadian Dollar USDCAD 15-minute chart
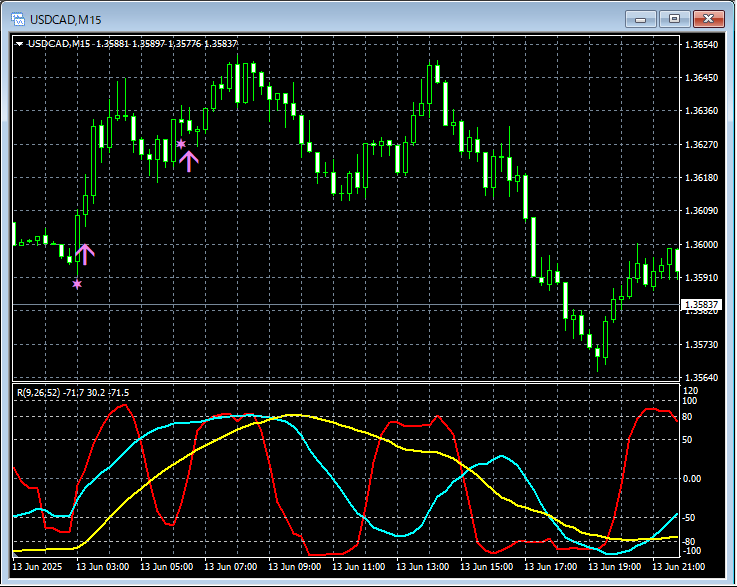
R1R2S2Signs
In the 15-minute chart above,R1R2S2pullback buy signals light up at two timely moments.to light up,
Using the RCI three-lineto drill down from higher to lower timeframes,wait for mBDSR signalsifthe mBDSR signal does not light up, or you miss or are late,R1R2S2 signalsmay still be used to respond,R1R2S2is often used in conjunction withmBDSR.
Note,R1R2S2has a version-up added today (June 14, 2025). For details, please see the Investment Navigator+ below.
Regarding the addition of the upgraded version of [R1R2S2]
Indicator that shines in combination with RCI【BODSOR・mBDSR】
Methods and Case Studies (PDF) ★GogoJungle AWARD2020 Winner★
https://www.gogojungle.co.jp/tools/indicators/11836
A PDF file is attached with 358 items (over 1,400 pages, over 470,000 words).
Many of these areexamples that lay out how to logically link higher and lower timeframes using the three-line RCI, then gradually examine the conditions of multiple lower timeframes, ultimately waiting for pullbacks or rallies (i.e., mBDSR signals) on the lower timeframe.
Additionally,many of them focus on identifying points where multiple entry reasons overlap.
Furthermore,there are methods that explore ascent targets and decline targets using the three-line RCI.
In the PDF file descriptions,over 1,350 chartsare used.

× ![]()


