

【Yesterday's NZDCAD 5-minute chart】Signal of R1R2S2 using two-stage RCI判定
===============================
↓↓↓ Free recommended articles.
[Permanent Edition] USD/JPY Analysis Example
(Signals of RCI with candlestick patterns, moving averages, chart patterns, mBDSR and R1R2S2)
https://www.gogojungle.co.jp/finance/navi/articles/90838
===============================
【Master RCI!! Trend Reversal, Buy on Dips, Sell on Rallies】
An indicator that shines in combination with RCI【BODSOR・mBDSR】
and methods, case studies (PDF) ★GogoJungle AWARD2020 winner★
https://www.gogojungle.co.jp/tools/indicators/11836
R1R2S2is included in the above product. For details, please read the article below on Investment Navigator+.
RCI three-line “Two-stage Judgment” to target trend reversals, dips, and rallies with the indicator “R1R2S2” released!!
Below,R1R2S2signals are introduced as examples.
New Zealand Dollar / Canadian Dollar NZDCAD 5-minute chart
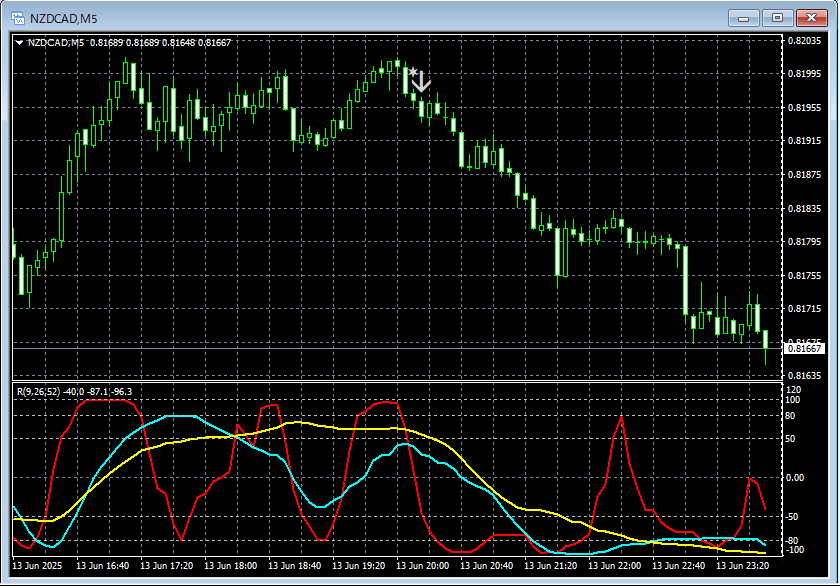
R1R2S2signals
Looking at the 5-minute chart above,R1R2S2reversal-sell signal captures the timing of the downward move well.
RCI three-lineused to drill down from higher to lower timeframes,mBDSR signalsled to a state where we wait for the mBDSR signal to light up,mBDSR signalsif they do not light up, or if you miss or are late,R1R2S2 signalscan sometimes be used,R1R2S2is often used in conjunction withmBDSR.
Note thatR1R2S2has a upgraded version added today (June 14, 2025). For details, please read the article below on Investment Navigator+.
【About the addition of the R1R2S2 upgraded version】
The indicator【BODSOR・mBDSR】 that shines in combination with RCI
and methods, case studies (PDF) ★GogoJungle AWARD2020 winner★
https://www.gogojungle.co.jp/tools/indicators/11836
The PDF file includes 358 files (over 1,400 pages, over 470,000 characters).
Many of them areexamples that break down how to link upper and lower timeframes logically using the three-line RCI, and eventually wait for dips or rallies (i.e., mBDSR signals) on the lower timeframes..
Also,many focus on capturing points where multiple entry reasons coincide..
Additionally,there are methods exploring upside and downside targets using the three-line RCI..
In the PDF explanations,over 1,350 chartsare used.

× ![]()


