

[Yesterday's EUR/CHF 5-minute chart] Signals of R1R2S2 using two-stage RCI judgment (also noting a double bottom)
=================
↓↓↓ This is a free recommended article.
[Master Edition] USD/JPY Analysis Example
(Signs of RCI, candlestick patterns, moving averages, chart patterns, mBDSR, and R1R2S2)
https://www.gogojungle.co.jp/finance/navi/articles/90838
=================
[Mastering RCI!! Trend Reversal, Buy on Dips, Sell on Rallies]
Indicator that shines in combination with RCI: [BODSOR・mBDSR]
and its methods, case studies (PDF) ★GogoJungle AWARD2020 Winner★
https://www.gogojungle.co.jp/tools/indicators/11836
R1R2S2is included in the above products. For details, please see the following Investment Navi+ article.
RCI3-line “Two-stage Confirmation” to target trend reversal, buy on dips, and sell on rallies — R1R2S2 released!!
Below,we紹介examples of signals for R1R2S2.
Euro/Swiss EURCHF 5-minute chart
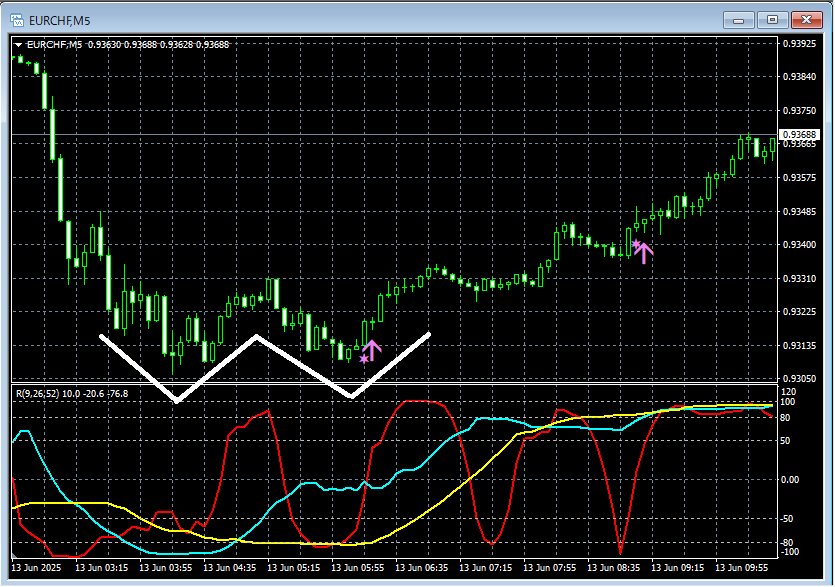
R1R2S2signals
Looking at the 5-minute chart above,R1R2S2buy-on-dip signal is catching the timing of the rise on the right peak of the double bottom and the subsequent dip-buying timing well.
Using the three RCI linesto translate from higher timeframes to lower timeframes,wait for the mBDSR signalto light up, andif the mBDSR signal does not light upor you miss it or are late,R1R2S2 signalscan sometimes be used to respond, andR1R2S2is often used in conjunction withmBDSR.
Additionally,R1R2S2has a version-up added today (June 14, 2025). For details, please see the following Investment Navi+.
About the version-up of 【R1R2S2】
The indicator that shines in combination with RCI【BODSOR・mBDSR】
and its methods, case studies (PDF) ★GogoJungle AWARD2020 Winner★
https://www.gogojungle.co.jp/tools/indicators/11836
The PDF file contains 358 items (over 1,400 pages, over 470,000 characters in total).
Most of them areexamples that break down the relationship between higher and lower timeframes using the RCI three-line method, sequentially analyzing multiple lower timeframes and ultimately waiting for a dip-buy or rally-sell timing (the mBDSR signal) on the lower timeframe..
Also,many of them emphasize identifying points where multiple entry reasons overlap..
Additionally,there are methods to explore upside and downside targets using the RCI three-line method..
In the PDF explanations,more than 1,350 chartsare used.

× ![]()


