

[Yesterday's USDCAD 5-minute chart] R1R2S2 signals using two-stage RCI判定
====================================
↓↓↓ This is a free recommended article.
[Preserved Version] USD/JPY Analysis Example
(Signals of RCI, candlestick patterns, moving averages, chart patterns, mBDSR, and R1R2S2)
https://www.gogojungle.co.jp/finance/navi/articles/90838
====================================
【Mastering RCI!! Trend Reversal, Buy on Dips, Sell on Rises】
Indicator that shines in combination with RCI: 【BODSOR・mBDSR】
and Methods & Case Studies (PDF) ★GogoJungle AWARD2020 Winner★
https://www.gogojungle.co.jp/tools/indicators/11836
R1R2S2is included in the above product. For details, please see the following Investor Navigate+ article.
RCI 3-line “Two-stage Judgment” to target trend reversal, buy on dips, and sell on rallies – R1R2S2 Release!!
Below,R1R2S2signals are introduced.
US Dollar / Canadian Dollar USDCAD 5-minute chart
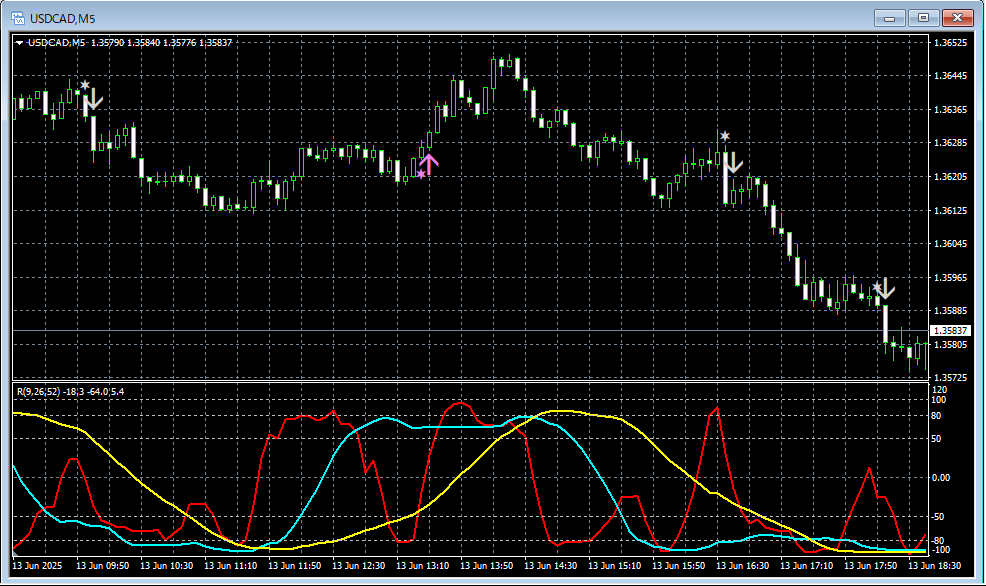
R1R2S2signals
In the above 5-minute chart,R1R2S2buy-the-dip signal lights up once, and sell-on-rally signal lights up three times.
is used to map from higher time frame to lower time frame,waiting for mBDSR signalsto light up, and in cases wheremBDSR signalsdo not light up, or signals are missed or late,R1R2S2 signalscan be used to respond, andR1R2S2is often used in conjunction withmBDSR.
Note thatR1R2S2has a version-up version added today (June 14, 2025). For details, please see the following Investor Navigate+ article.
About the Version-Up of 【R1R2S2】
The indicator that shines in combination with RCI: 【BODSOR・mBDSR】
and Methods & Case Studies (PDF) ★GogoJungle AWARD2020 Winner★
https://www.gogojungle.co.jp/tools/indicators/11836
The PDF file includes 358 files (over 1,400 pages, over 470,000 characters).
Many of these areexamples that outline how to logically link higher and lower time frames using the RCI three-line, examine multiple lower-time-frame states in sequence, and finally wait for a dip-buy or pullback timing (i.e., mBDSR signals) on the lower time frame.
Also,many entries emphasize identifying points where multiple entry reasons overlap.
Additionally,the method to explore upside/downside targets using the RCI three-lineis included.
In the PDF descriptions,more than 1,350 chartsare used.

× ![]()


