

[Yesterday's Pound-Yen 5-minute chart] R1R2S2 signals using the two-stage RCI判定
===============================
↓↓↓ This is a recommended free article.
[Comprehensive Edition] USD/JPY Analysis Example
(Signals of RCI and candlestick patterns, moving averages, chart patterns, mBDSR, and R1R2S2)
https://www.gogojungle.co.jp/finance/navi/articles/90838
===============================
[Mastering RCI!! Trend Reversal, Buy the Dip, Sell the Rally]
Indicator that shines in combination with RCI: 【BODSOR・mBDSR】
and method, case studies (PDF) ★GogoJungle AWARD2020 Winner★
https://www.gogojungle.co.jp/tools/indicators/11836
R1R2S2is included in the above product. For details, please see the investment guide + article below.
RCI triple-line using a two-stage Judgment to target trend reversal, buy the dip, and sell the rally — R1R2S2 released!!
Below,R1R2S2signals are introduced as examples.
GBP/JPY 5-minute chart
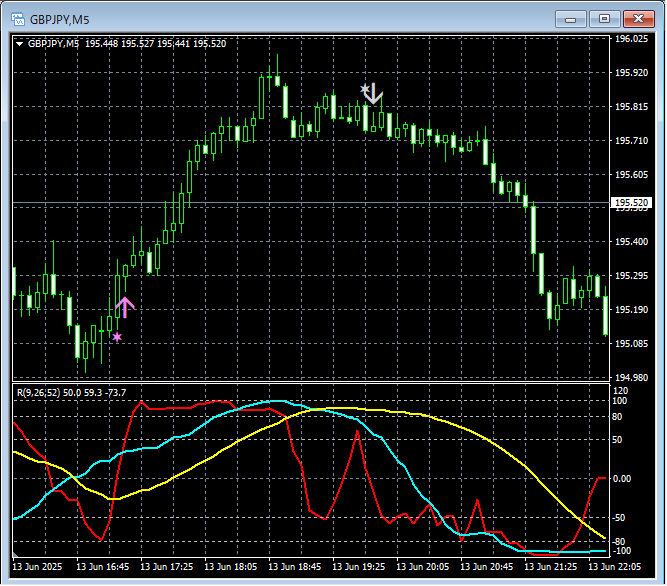
R1R2S2signals
In the above 5-minute chart,R1R2S2buy-the-dip signal and sell-the-rally signal light up once each.
Using the RCI triple-lineto break down from higher timeframes to lower timeframes,and waiting for the mBDSR signalto light up,when the mBDSR signaldoes not light up, or when signals are overlooked or late,the R1R2S2 signalcan be used to respond,andR1R2S2is often used together withmBDSR
Note thatR1R2S2was updated today (June 14, 2025). For details, please see the investment guide + below.
About the addition of the R1R2S2 version upgrade
The indicator that shines in combination with RCI: 【BODSOR・mBDSR】
and method, case studies (PDF) ★GogoJungle AWARD2020 Winner★
https://www.gogojungle.co.jp/tools/indicators/11836
The PDF file includes 358 files (over 1,400 pages, over 470,000 characters).
Most of them areexamples that link multiple higher and lower timeframes logically using the RCI triple-line, ultimately breaking down to waiting for the lower timeframe’s buy-the-dip or sell-the-rally timing (i.e., the mBDSR signal)..
Also,many focus on capturing points where multiple entry reasons overlap..
Additionally,there are methods to explore potential upside and downside using the RCI triple-line..
In the PDF descriptions,more than 1,350 chartsare used.

× ![]()


