

[Most recent AUDJPY 15-minute chart] Signs of R1R2S2 using two-stage RCI判定
========================================
↓↓↓ Free recommended articles.
[Comprehensive Edition] USD/JPY Analysis Example
(Signals of RCI and candlestick patterns, moving averages, chart patterns, mBDSR, and R1R2S2)
https://www.gogojungle.co.jp/finance/navi/articles/90838
========================================
[Master RCI!! Trend Reversal, Buy on Dips, Sell on Rises]
Indicators that shine in combination with RCI: [BODSOR・mBDSR]
Methods & Case Studies (PDF) ★GogoJungle AWARD2020 Winner★
https://www.gogojungle.co.jp/tools/indicators/11836
R1R2S2is included in the above product. For details, please see the following Investment Navi+ article.
RCI 3 lines ‘Two-stage Judgment’ to target trend reversal, buy on dips, and sell on rallies — Release of the indicator “R1R2S2”
Below,We introduce examples of signals for R1R2S2
AUDJPY 15-minute chart
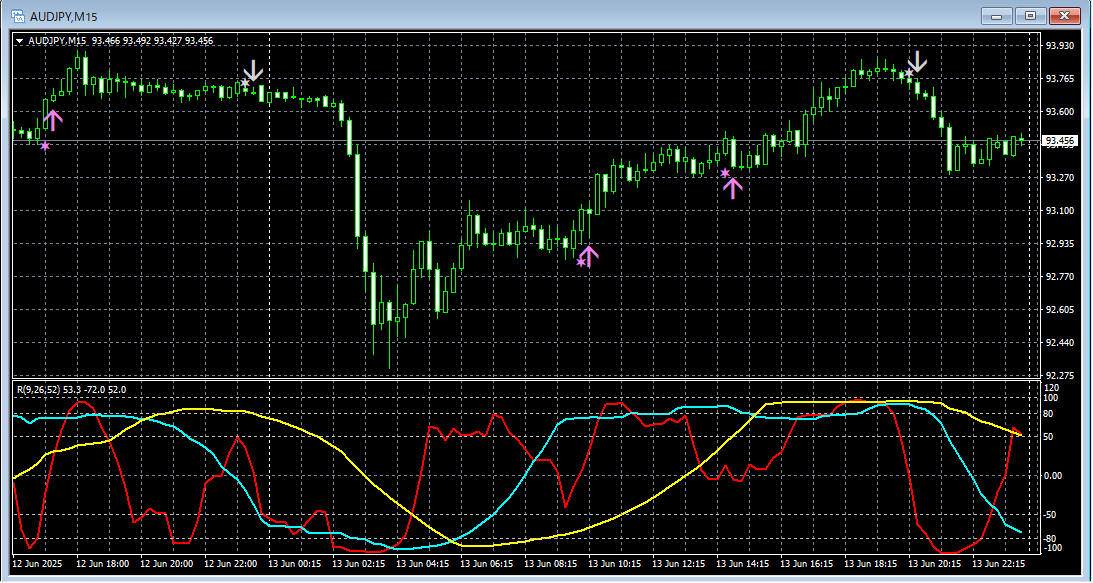
R1R2S2Signals
In the most recent AUDJPY 15-minute chart,R1R2S2buy-on-dip signals appeared 3 times and sell-on-rally signals appeared 2 times.
Using the RCI three-line lineto drill down from higher to lower timeframes,waiting for mBDSR signalsto light up,if the mBDSR signalsdo not light up or were missed or delayed,the R1R2S2 signalscan sometimes be used to respond, andR1R2S2is often used in conjunction withmBDSR.
In addition,R1R2S2was updated today (June 14, 2025). For details, please see the following Investment Navi+ article.
About the version upgrade of [R1R2S2]
Indicators that shine in combination with RCI: [BODSOR・mBDSR]
Methods & Case Studies (PDF) ★GogoJungle AWARD2020 Winner★
https://www.gogojungle.co.jp/tools/indicators/11836
The PDF file includes 358 items (over 1,400 pages, over 470,000 characters total).
Many of them are examples that break down the situation across multiple lower timeframes by logically linking upper and lower timeframes using three-line RCI, ultimately waiting for dip buys or rallies on the lower timeframes via mBDSR signals.
Additionally,many focus on identifying points where multiple entry reasons overlap..
Also included is a method to explore upside and downside targets using the three-line RCI.
In the PDF explanations,more than 1,350 chartsare used.

× ![]()


