

Using both the sign of mBDSR (RCI2 bandpass filter) and the sign of R1R2S2 (27) GBPNZD 15-minute chart
0
=================
【RCI Related】Free Indicator and Free E-Books from Blacksun
https://www.gogojungle.co.jp/finance/navi/articles/90181
=================
【Mastering RCI!! Trend Reversal, Buy on Dips, Sell on Rallies】
Indicators that shine in combination with RCI【BODSOR・mBDSR】
and Techniques・Case Studies (PDF) ★GogoJungle AWARD2020 Winner★
https://www.gogojungle.co.jp/tools/indicators/11836
R1R2S2is included in the above products. For details, please see the article below in the Investment Navi+.
RCI 3-line “2-step Confirmation” to target Trend Reversal, Buy on Dips, and Sell on Rallies - Indicator “R1R2S2” Released!!
(https://www.gogojungle.co.jp/finance/navi/articles/61588)
Also,R1R2S2is supplemented with PDFs (methods・case studies) as needed. For details, please see the article below in the Investment Navi+.
PDF Collection to Effectively Use R1R2S2【Master RCI and Win!!】
(https://www.gogojungle.co.jp/finance/navi/articles/93154)
Below,mBDSR (RCI 2-Filter)andR1R2S2signs are shown together in an example.
GBPNZD 15-minute chart
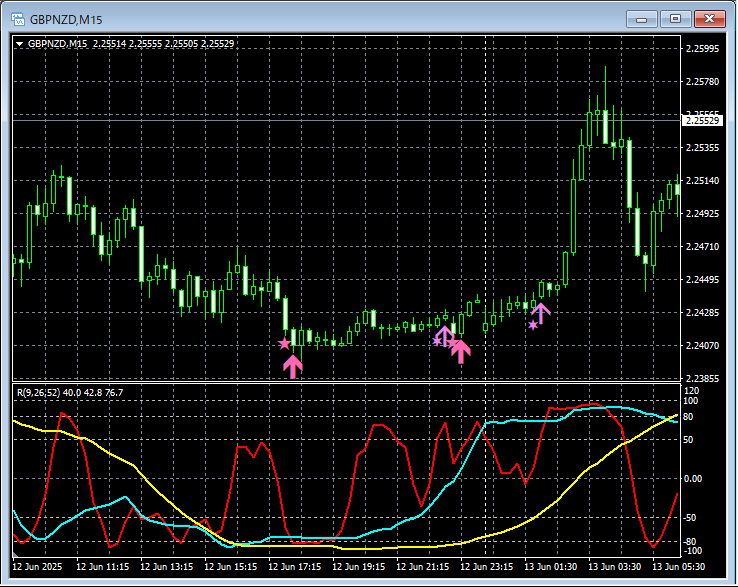
mBDSR (RCI 2-Filter)andR1R2S2signs
In the 15-minute chart above,the buy-on-dip signal of mBDSR (RCI 2-Filter)andthe buy-on-dip signal of R1R2S2both lit up twice, and the price rose steadily.
RCI three-lineis downscaled from higher to lower timeframes,waiting for the mBDSR signalto light up,if the mBDSR signal does not light up,or if you miss or are late to see it,the R1R2S2 signalmay be able to respond, andR1R2S2is often used in conjunction withmBDSR.
Indicators that shine in combination with RCI【BODSOR・mBDSR】
and Techniques・Case Studies (PDF) ★GogoJungle AWARD2020 Winner★
https://www.gogojungle.co.jp/tools/indicators/11836
There are over 500 PDFs attached (methods・case studies: over 1,850 pages, over 650,000 characters).
Most of them are designed to logically link higher and lower timeframes using the RCI 3-line, analyzing the状況 of multiple lower timeframes in sequence, and finally waiting for a dip-buy or rally-sell timing (i.e., the mBDSR signal) on the lower timeframe.
Also,many emphasize identifying points where multiple entry reasons overlap..
Additionally,techniques for exploring upside targets and downside targets using the RCI 3-lineare included.
In the PDF explanations,more than 1,800 chartsare used.

=================
↓↓↓Recommended free articles.
【Keeper】 USD/JPY Analysis Example
(RCI and candlestick patterns and moving averages and chart patterns and mBDSR and R1R2S2 signals)
https://www.gogojungle.co.jp/finance/navi/articles/90838
=================
× ![]()


