

Master RCI to the extreme!! Use both signals of mBDSR (Moving Average Filter) and R1R2S2 (2) Gold XAUUSD
================================
【RCI Related】Free indicator and free e-book for Blacksun
https://www.gogojungle.co.jp/finance/navi/articles/90181
================================
【Master RCI!! Trend Reversal, Buy Dips, Sell Rallies】
Indicator that shines in combination with RCI【BODSOR・mBDSR】
and techniques & case studies (PDF) ★GogoJungle AWARD2020 winner★
https://www.gogojungle.co.jp/tools/indicators/11836
R1R2S2is included in the products above. For details, please see the article below in the Investing Navi+.
RCI 3-line “Two-Stage Judgment” to target trend reversals, dip buying, and rally selling—Indicator “R1R2S2” released!!
(https://www.gogojungle.co.jp/finance/navi/articles/61588)
Also,R1R2S2PDFs (methods & case studies) are added as appropriate to help you use it effectively. For details, please see the article below in the Investing Navi+.
PDF collection to effectively utilize R1R2S2【Master RCI and win!!】
(https://www.gogojungle.co.jp/finance/navi/articles/93154)
Below,mBDSR (Moving Average Filter)andR1R2S2signs are shown together as an example.
Gold XAUUSD 1-hour chart
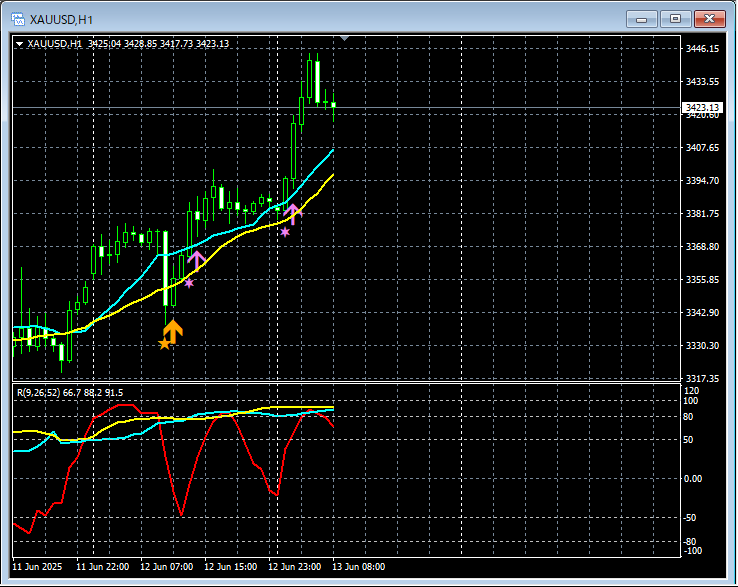
mBDSR (Two MA filter)andR1R2S2signs
In the above 1-hour chart,mBDSR dip-buy signallights up and price rises again. After that,R1R2S2 dip-buy signalslight up twice and price rises further.
Waiting for the signal of mBDSRto light up,if the mBDSR signal does not light upor if it is overlooked or delayed,the R1R2S2 signalmay be able to respond,R1R2S2isoften used in conjunction withmBDSR.
Indicator that shines in combination with RCI【BODSOR・mBDSR】
and techniques & case studies (PDF) ★GogoJungle AWARD2020 winner★
https://www.gogojungle.co.jp/tools/indicators/11836
A PDF set with 500+ files (techniques & case studies: total over 1,850 pages, over 650,000 characters) is attached.
Most of them aresummaries of how using the RCI 3-line, linking higher and lower timeframes logically, considers multiple lower timeframes sequentially, and ultimately waits for a dip-buy or rally-sell timing (i.e., mBDSR signals) on the lower timeframes..
Also,many focus on capturing points where multiple entry reasons overlap..
Additionally,there are methods that explore upside or downside targets using the RCI 3-line..
In the PDF explanations,more than 1,800 chartsare used.

================================
↓↓↓ Recommended free articles.
【Final Edition】Dollar/Yen Analysis Example
(RCI and candlestick patterns and moving averages and chart patterns and mBDSR and R1R2S2 signs)
https://www.gogojungle.co.jp/finance/navi/articles/90838
================================
× ![]()


