

【Master RCI!!】Using the signs of R1R2S2 (12) Pound Dollar
=================
【RCI Related】Free Indicators and Free E-books from Blacksun
https://www.gogojungle.co.jp/finance/navi/articles/90181
=================
【Mastering RCI!! Trend Reversal, Buy the Dip, Sell on Rallies】
Indicators that excel in combination with RCI【BODSOR・mBDSR】
and methods & case studies (PDF) ★GogoJungle AWARD 2020 winner★
https://www.gogojungle.co.jp/tools/indicators/11836
R1R2S2is included in the products above. For details, please see the article below in the Investment Navi+.
RCI 3-line “Two-stage Confirmation” to target trend reversals, dips, and rallies Indicator “R1R2S2” released!!
(https://www.gogojungle.co.jp/finance/navi/articles/61588)
Also,R1R2S2PDFs (methods & case studies) are being added as needed. For details, please see the article below in the Investment Navi+.
PDF collection to effectively utilize R1R2S2【Master RCI and Win!!】
(https://www.gogojungle.co.jp/finance/navi/articles/93154)
Below,R1R2S2sign examples are introduced.
Pound-Dollar GBPUSD 1-minute chart
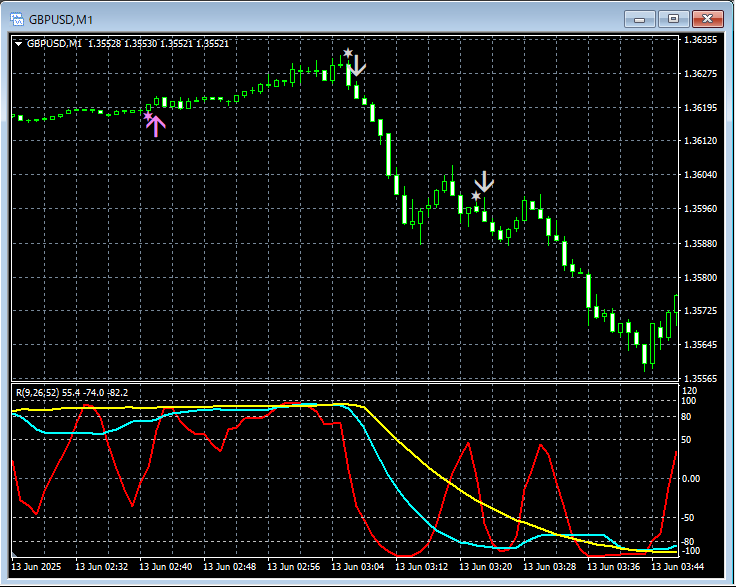
R1R2S2signs
On the 30-minute chart above,R1R2S2dip-buy and rally-sell signals light up in time.
Using the RCI 3-lineto drill down from higher to lower timeframes,mBDSRsignals light up, andmBDSRR1R2S2signals can sometimes be used to respond, andR1R2S2is often used in conjunction withmBDSR.
Indicators that excel in combination with RCI【BODSOR・mBDSR】
and methods & case studies (PDF) ★GogoJungle AWARD 2020 winner★
https://www.gogojungle.co.jp/tools/indicators/11836
More than 500 PDF files (methods & case studies: total over 1,850 pages, over 650,000 characters).
Many of them are examples where multiple lower time-frame situations are logically linked by using the RCI 3-line to sequentially examine multiple lower time frames and finally wait for the dip-buying or rally-selling timing (i.e., mBDSR signals) on the lower time frames.
Also,many focus on capturing points where multiple entry reasons overlap.There are many such cases.
In addition,there are methods to explore upside and downside targets using the RCI 3-line.Also included.
In the PDF descriptions,more than 1,800 chartsare used.

=================
↓↓↓ Recommended free articles.
【Master Copy】USD/JPY Analysis Example
(RCI and candlestick patterns, moving averages, chart patterns, and mBDSR and R1R2S2 signals)
https://www.gogojungle.co.jp/finance/navi/articles/90838
=================
× ![]()


