

Use both the sign of mBDSR (RCI2 single-band filter) and the sign of R1R2S2 (25) AUD/JPY 15-minute chart
=================
【RCI-Related】Free indicators and free eBooks from Blacksun
https://www.gogojungle.co.jp/finance/navi/articles/90181
=================
【Mastering RCI!! Trend Reversal, Buy on Dips, Sell on Rallies】
Indicator that shines in combination with RCI: 【BODSOR・mBDSR】
and techniques & case studies (PDF) ★GogoJungle AWARD2020 winner★
https://www.gogojungle.co.jp/tools/indicators/11836
R1R2S2is included in the above products. For details, please read the article in the Investment Navi+ below.
RCI 3-line “Two-Stage Confirmation” to Aim for Trend Reversal, Buy on Dips, and Sell on Rallies Indicator “R1R2S2” Release!!
(https://www.gogojungle.co.jp/finance/navi/articles/61588)
Also,R1R2S2is supplemented with PDFs (methods & case studies) as appropriate. For details, please read the article in the Investment Navi+ below.
PDF collection to effectively utilize R1R2S2【Master RCI and Win!!】
(https://www.gogojungle.co.jp/finance/navi/articles/93154)
Below,mBDSR (RCI two-filter) andR1R2S2signs are shown together as examples.
AUDJPY 15-minute chart
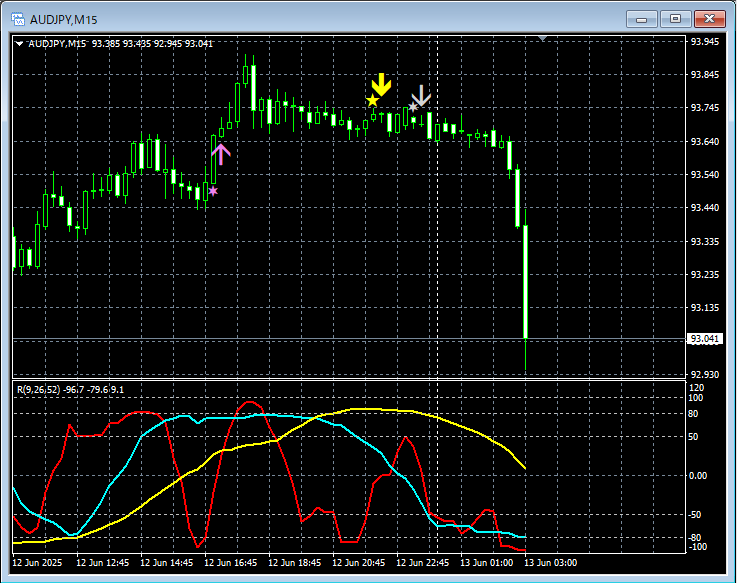
mBDSR (RCI two-filter)andR1R2S2signs
In the above 15-minute chart,R1R2S2 buy-on-dip signallights up and the price rises, then begins to retreat.mBDSR (RCI two-filter) sell-on-rally signallights up, andR1R2S2 sell-on-rally signalalso lights up, and the price declines firmly.
Using the RCI 3-lineto descend from higher timeframes to lower timeframes,waiting for the signals of mBDSRto light up,when the mBDSR signals do not light up or are missed or arrive late,the R1R2S2 signalsmay be used to respond, andR1R2S2is often used in conjunction withmBDSR.Indicator that shines in combination with RCI【BODSOR・mBDSR】and techniques & case studies (PDF) ★GogoJungle AWARD2020 winner★https://www.gogojungle.co.jp/tools/indicators/11836More than 500 PDFs (methods & case studies: over 1,850 pages, over 650,000 words) are included.Many of these are:Examples that break down multiple lower-timeframe conditions by logically linking higher and lower timeframes using the RCI 3-line, ultimately waiting for the lower-timeframe dips or rallies timing (i.e., the mBDSR signal).Also,many emphasize capturing points where multiple entry reasons overlap..In addition,there are methods to explore upside targets and downside targets using the RCI 3-line..In the PDF explanations,more than 1,800 chartsare used.=================↓↓↓ Recommended free articles.【Save Version】Dollar-Yen Analysis Example(RCI and candlestick patterns and moving averages and chart patterns and mBDSR and R1R2S2 signals)https://www.gogojungle.co.jp/finance/navi/articles/90838=================the R1R2S2 signalsmay be used to respond, andR1R2S2is often used in conjunction withmBDSR.
Indicator that shines in combination with RCI【BODSOR・mBDSR】
and techniques & case studies (PDF) ★GogoJungle AWARD2020 winner★
https://www.gogojungle.co.jp/tools/indicators/11836
More than 500 PDFs (methods & case studies: over 1,850 pages, over 650,000 words) are included.
Many of these are:Examples that break down multiple lower-timeframe conditions by logically linking higher and lower timeframes using the RCI 3-line, ultimately waiting for the lower-timeframe dips or rallies timing (i.e., the mBDSR signal).
Also,many emphasize capturing points where multiple entry reasons overlap..
In addition,there are methods to explore upside targets and downside targets using the RCI 3-line..
In the PDF explanations,more than 1,800 chartsare used.

=================
↓↓↓ Recommended free articles.
【Save Version】Dollar-Yen Analysis Example
(RCI and candlestick patterns and moving averages and chart patterns and mBDSR and R1R2S2 signals)
https://www.gogojungle.co.jp/finance/navi/articles/90838
=================
× ![]()


