

Using both the signs of mBDSR (RCI2 full filter) and the signs of R1R2S2 (24) Pound-Dollar 1-minute chart
====================================
【RCI Related】Free Indicator and Free eBook about Blacksun
https://www.gogojungle.co.jp/finance/navi/articles/90181
====================================
【Mastering RCI!! Trend Reversal, Buy on Dips, Sell on Rallies】
Indicator that shines when combined with RCI: 【BODSOR・mBDSR】
and Method・Case Studies (PDF) ★GogoJungle AWARD2020 Winner★
https://www.gogojungle.co.jp/tools/indicators/11836
R1R2S2is included in the above products. For details, please see the article below in the Investment Navigator+.
RCI trio 'Two-stage Confirmation' to target Trend Reversal, Buy on Dips, and Sell on Rallies: Indicator "R1R2S2" Release!!
(https://www.gogojungle.co.jp/finance/navi/articles/61588)
Also,R1R2S2A PDF (Methods・Case Studies) to effectively use it is added as appropriate. For details, please see the article below in the Investment Navigator+.
PDF collection to effectively use R1R2S2【Master RCI and Win!!】
(https://www.gogojungle.co.jp/finance/navi/articles/93154)
Below,mBDSR (Two RCI lines filter)andR1R2S2signs are shown simultaneously as examples.
GBPUSD 1-minute chart
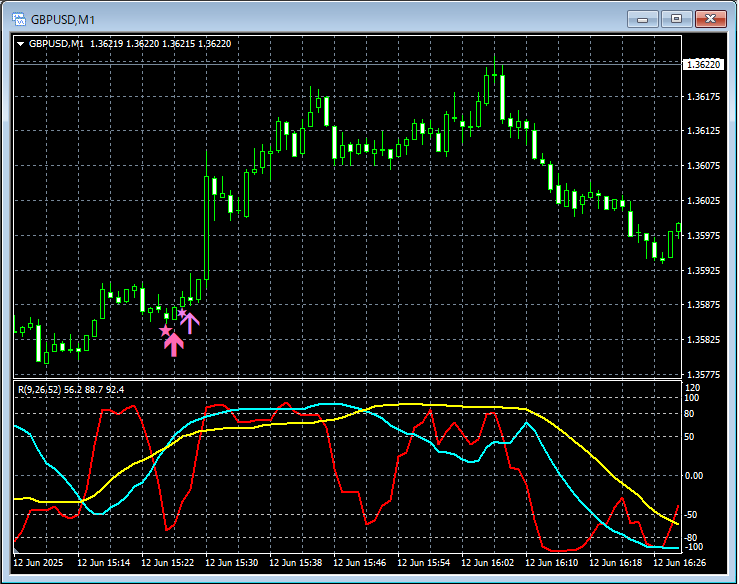
mBDSR (Two RCI lines filter)andR1R2S2
In the above 1-minute chart,Buy on dips signal of mBDSR (two RCI lines filter)lights up, andlights up, and the price rises firmly.Buy on dips signal of R1R2S2
RCI three-line cross-down to upper to lower timeframeand wait for the lights ofmBDSR signalson the lower timeframes; ifmBDSR signalsdo not light up, or if you missed or delayed signals,R1R2S2 signalscan be used to respond,R1R2S2isoften used in conjunction withmBDSR.
Indicator that shines when combined with RCI: 【BODSOR・mBDSR】
and Method・Case Studies (PDF) ★GogoJungle AWARD2020 Winner★
https://www.gogojungle.co.jp/tools/indicators/11836
More than 500 PDFs (Methods・Case Studies: over 1,850 pages, over 650,000 characters) are included.
Many of these present examples where the higher-timeframe and lower-timeframe are logically linked using the RCI three-line, then the lower-timeframe waiting for a buy on dips or sell on rallies signal from mBDSR is translated into a sequence of observations.
Also,Many items emphasize pinpointing points where multiple entry reasons overlap.There are also many such items.
In addition,there are methods that explore upward and downward targets using the RCI three lines.These are included as well.
In the PDF explanations,more than 1,800 chartsare used.

====================================
↓↓↓ Recommended free articles.
【 definitive version 】 USD/JPY analysis example
(RCI and candlestick patterns and moving averages and chart patterns and mBDSR and R1R2S2 signs)
https://www.gogojungle.co.jp/finance/navi/articles/90838
====================================
× ![]()


