

Use both the sign of mBDSR (RCI2 double filter) and the sign of R1R2S2 (23) USD/JPY 1-minute chart
0
====================================
【RCI Related】Free BlackSun indicators and free eBooks
https://www.gogojungle.co.jp/finance/navi/articles/90181
====================================
【Master RCI!! Trend Reversal, Buy Dips, Sell Rallies】
Indicators that excel in combination with RCI【BODSOR・mBDSR】
Methods and Case Studies (PDF) ★GogoJungle AWARD 2020 Winner★
https://www.gogojungle.co.jp/tools/indicators/11836
R1R2S2is included in the above products. For details, please refer to the article below in 投資ナビ+ (Investment Navi+).
RCI 3-line “Two-step Confirmation” to target trend reversals, buy dips, and sell rallies: The release of “R1R2S2”
(https://www.gogojungle.co.jp/finance/navi/articles/61588)
Also,R1R2S2PDFs (Methods & Case Studies) are being added as needed. For details, please see the article below in 投資ナビ+.
PDF collection to effectively utilize R1R2S2【Master RCI to Win!!】
(https://www.gogojungle.co.jp/finance/navi/articles/93154)
Below,mBDSR (RCI two-line filter)andR1R2S2signals shown simultaneously are introduced as examples.
USD/JPY 1-minute chart
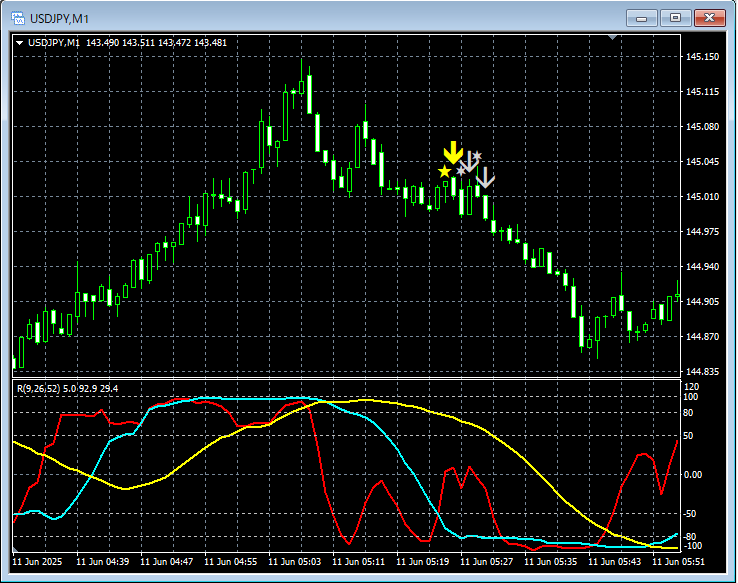
mBDSR (RCI two-line filter)andR1R2S2
In the above 1-minute chart, during a decline,the mBDSR return-sell signallights up, and immediately afterthe R1R2S2 return-sell signal lights up twice.
RCI 3-lineis used to drill down from higher to lower timeframes,waiting for mBDSR signalsto light up,if the mBDSR signal does not light up, or if you miss or are late,there are cases where the R1R2S2 signal can be used instead,andR1R2S2often used in conjunction with.
Indicators that excel in combination with RCI【BODSOR・mBDSR】
Methods and Case Studies (PDF) ★GogoJungle AWARD2020 winner★
https://www.gogojungle.co.jp/tools/indicators/11836
More than 500 PDFs (Methods & Case Studies: over 1,850 pages, over 650,000 words) are included.
Most of them are designed to logically link higher and lower timeframes using the RCI 3-line, then sequentially examine multiple lower timeframes, ultimately waiting for the timing of dips (or rallies) in the lower timeframes (i.e., the mBDSR signal).
Also,many of them emphasize capturing points where multiple entry reasons overlap..
Also included are methods for exploring upside and downside targets using the RCI 3-line.
In the PDF explanations,more than 1,800 chartsare used.

====================================
↓↓↓ Recommended free articles.
【Ultimate Guide】Dollar/Yen Analysis Example
(RCI, candlestick patterns, moving averages, chart patterns, mBDSR, and R1R2S2 signals)
https://www.gogojungle.co.jp/finance/navi/articles/90838
====================================
× ![]()


