

Use both the sign of mBDSR (RCI2 bandpass filter) and the sign of R1R2S2 (22) AUD/JPY 1-minute chart
0
=================
【RCI Related】Free indicator and free e-book from Blacksun
https://www.gogojungle.co.jp/finance/navi/articles/90181
=================
【Master RCI!! Trend Reversal, Buy on Dips, Sell on Rallies】
Indicators that pair with RCI to unleash power: 【BODSOR・mBDSR】
and Techniques & Case Studies (PDF) ★GogoJungle AWARD2020 Winner★
https://www.gogojungle.co.jp/tools/indicators/11836
R1R2S2is included in the above products. For details, please read the article below in Investment Navi+.
RCI 3-line “Two-stage Judgment” to target trend reversals, buy on dips, and sell on rallies: Indicator “R1R2S2” released!!
(https://www.gogojungle.co.jp/finance/navi/articles/61588)
Also,R1R2S2is complemented by PDFs (methods & case studies) added as appropriate. For details, please read the article below in Investment Navi+.
PDF collection for effectively using R1R2S2【Master RCI and Win!!】
(https://www.gogojungle.co.jp/finance/navi/articles/93154)
Below,mBDSR (RCI two-filter)andR1R2S2signs are shown simultaneously in an example.
AUD/JPY 1-minute chart
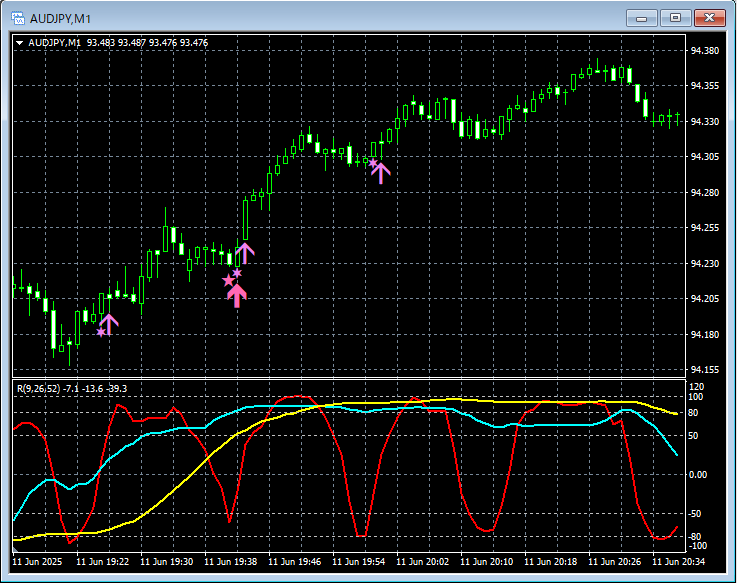
mBDSR (RCI two-filter)andR1R2S2
On the 1-minute chart above, during an up move,the buy-dip signal of mBDSR (RCI two-filter)is lit once,the buy-dip signal of R1R2S2is lit three times.
RCI three-lineis used to filter down from higher to lower timeframes,waiting for the mBDSR signalsto light,when the mBDSR signalsdo not light or when signals are missed or late,R1R2S2 signalscan sometimes be used to respond,R1R2S2isoften used in conjunction withmBDSR.
Indicators that are powerful in combination with RCI【BODSOR・mBDSR】
and techniques & case studies (PDF) ★GogoJungle AWARD2020 Winner★
https://www.gogojungle.co.jp/tools/indicators/11836
More than 500 PDFs (techniques & case studies: over 1,850 pages, over 650,000 characters) are included.
Most of them are aimed at logically linking higher and lower timeframes using the three-line RCI, examining multiple lower-timeframe conditions step by step, and ultimately waiting for dips in lower timeframes (i.e., mBDSR signals).
Additionally,many focus on identifying points where multiple entry reasons coincideas a primary emphasis.
Also included are techniques for exploring upside/downside targets using the RCI three-line.
In the PDF explanations,over 1,800 chartsare used.

=================
↓↓↓Recommended free articles.
【Comprehensive】Dollar/Yen Analysis Example
(RCI and candlestick patterns with moving averages and chart patterns and mBDSR and R1R2S2 signals)
https://www.gogojungle.co.jp/finance/navi/articles/90838
=================
× ![]()


