

Use both the sign of mBDSR (RCI2 single-filter) and the sign of R1R2S2 (21) Euro-yen 5-minute chart
=================
【RCI Related】Free indicators and free e-books from Blacksun
https://www.gogojungle.co.jp/finance/navi/articles/90181
=================
【Mastering RCI!! Trend Reversal, Buy on Dips, Sell on Rallies】
Indicators that shine in combination with RCI【BODSOR・mBDSR】
and Methods & Case Studies (PDF) ★GogoJungle AWARD2020 Winner★
https://www.gogojungle.co.jp/tools/indicators/11836
R1R2S2is included in the above products. For details, please see the Investment Navi+ article below.
RCI 3-line “Two-stage Confirmation” to Target Trends Reversals, Buy on Dips, and Sell on Rallies: Release of the indicator “R1R2S2”
(https://www.gogojungle.co.jp/finance/navi/articles/61588)
Also,R1R2S2PDFs (Methods & Case Studies) are added as needed to help you utilize it effectively. For details, please see the Investment Navi+ article below.
PDF collection to effectively utilize R1R2S2【Master RCI and Win!!】
(https://www.gogojungle.co.jp/finance/navi/articles/93154)
Below,mBDSR (RCI two-filter) andR1R2S2signs are shown simultaneously in an example.
EURJPY 5-minute chart
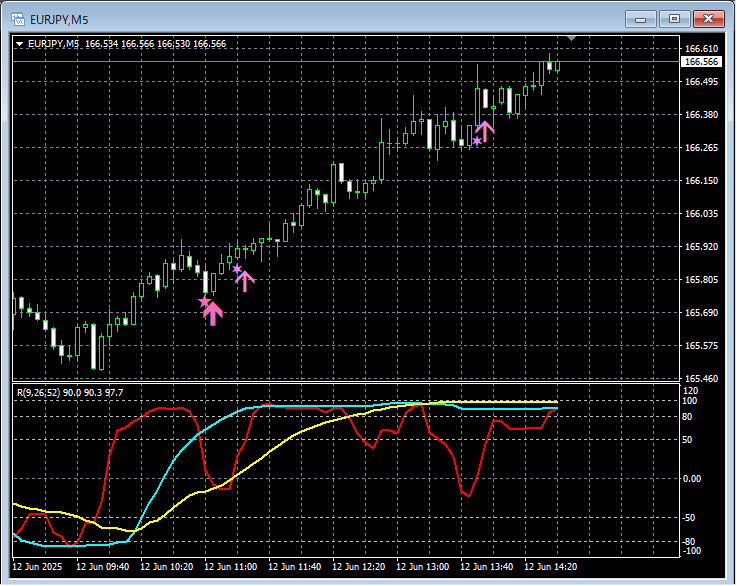
mBDSR (RCI two-filter)andR1R2S2signs
In the above 5-minute chart,the Buy-the-dip signal of mBDSR (RCI two-filter)lights up and the uptrend resumes. Thenthe Buy-the-dip signal of R1R2S2lights up and climbs further. Also in the subsequent up-move,the Buy-the-dip signal of R1R2S2lights up.
RCI Three-lineis used to drill down from higher to lower timeframes,wait for the mBDSR signalto light up, andif the mBDSR signal does not light up or is missed or late,the R1R2S2 signalR1R2S2may be used to respond,isoften used in conjunction withmBDSR
Indicators that shine in combination with RCI【BODSOR・mBDSR】
and Methods & Case Studies (PDF) ★GogoJungle AWARD2020 Winner★
https://www.gogojungle.co.jp/tools/indicators/11836
More than 500 PDF files (Methods & Case Studies: over 1,850 pages, over 650,000 words) are included.
Most of them are compiled as examples where multiple lower-timeframe situations are logically linked by using the RCI three-line across higher and lower timeframes, ultimately waiting for the timing to buy on dips or sell on rallies (i.e., the mBDSR signal) on the lower timeframes.
Also,many of them focus on capturing points where multiple entry reasons align.There are also many that include methods to explore upside targets and downside targets using the RCI three-line.
In the PDF explanations,
more than 1,800 chartsare used.

=================
↓↓↓ Recommended free articles.
【Master Copy】USD/JPY Analysis Example
(RCI and candlestick patterns and moving averages and chart patterns and mBDSR and R1R2S2 signals)
https://www.gogojungle.co.jp/finance/navi/articles/90838
=================
× ![]()


