

Utilize both the sign of mBDSR (RCI2 low-pass filter) and the sign of R1R2S2 (20) USD/JPY 30-minute chart
0
================================
↓↓↓ This is a free recommended article.
[Comprehensive Edition] USD/JPY Analysis Example
(Signals of RCI, candlestick patterns, moving averages, chart patterns, mBDSR, and R1R2S2)
https://www.gogojungle.co.jp/finance/navi/articles/90838
================================
[Mastering RCI!! Trend Reversal, Buy on Dips, Sell on Rallies]
An indicator that works powerfully in combination with RCI: [BODSOR・mBDSR]
and Methods・Case Studies (PDF) ★GogoJungle AWARD2020 Winner★
https://www.gogojungle.co.jp/tools/indicators/11836
R1R2S2is included in the above products. For details, please read the article below in the 投資ナビ+ (Investment Navi+).
RCI Three-Line “Two-Stage Confirmation” to Target Trend Reversal, Buy on Dips, and Sell on Rallies with the Indicator “R1R2S2” Released!!
(https://www.gogojungle.co.jp/finance/navi/articles/61588)
Also,R1R2S2is complemented by PDFs (Methods・Case Studies) added as appropriate. For details, please read the article below in the 投資ナビ+ (Investment Navi+).
PDF Collection for Effectively Using R1R2S2【Master RCI and Win!!】
(https://www.gogojungle.co.jp/finance/navi/articles/93154)
Below we introducemBDSR (RCI two-line filter) andR1R2S2signs displayed simultaneously.
USDJPY 30-minute chart
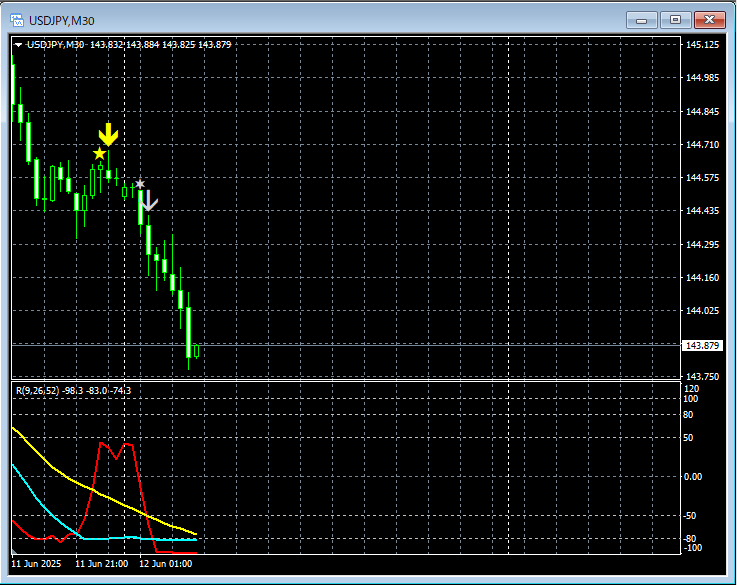
mBDSR (RCI two-line filter)andR1R2S2signs
On the above 30-minute chart,the sell-on-rally signal of mBDSR (RCI two-line filter)lights up as the decline resumes, andthe sell-on-rally signal of R1R2S2lights up, accelerating the decline.
Using the RCI Three-Lineto drill down from higher timeframes to lower timeframes,wait for the lighting of the mBDSR signaland bring the scene to a point wherethe mBDSR signaleither does not light up, is missed, or is late,the R1R2S2 signalmay be used to respond,R1R2S2isoften used in conjunction withmBDSR.
An indicator that shines in combination with RCI: [BODSOR・mBDSR]
and Methods・Case Studies (PDF) ★GogoJungle AWARD2020 Winner★
https://www.gogojungle.co.jp/tools/indicators/11836
The PDF file includes 358 files (over 1,400 pages, over 470,000 characters).
Most of them are structured as follows: using the RCI Three-Line to logically link higher and lower timeframes, sequentially considering the conditions of multiple lower timeframes, and ultimately waiting for the timing to buy on dips or sell on rallies in the lower timeframes (i.e., the signal of mBDSR).
In addition,many are focused on identifying points where multiple entry justifications overlap..
Also included is a method for exploring upside and downside targets using the RCI Three-Line.
In the PDF explanations,more than 1,350 chartsare used.

× ![]()


