

Using both the sign of mBDSR (RCI2本フィルター) and the sign of R1R2S2 (19) Pound-Dollar 5-minute chart
0
===============================
↓↓↓ Here are free articles recommended.
[Saving Edition] USD/JPY Analysis Example
(Signals of RCI and candlestick patterns, moving averages, chart patterns, mBDSR and R1R2S2)
https://www.gogojungle.co.jp/finance/navi/articles/90838
===============================
【Master RCI!! Trend Reversal, Buy the Dip, Sell the Rally】
An indicator that blends with RCI to deliver power: 【BODSOR・mBDSR】
Methods and case studies (PDF) ★GogoJungle AWARD2020 Winner★
https://www.gogojungle.co.jp/tools/indicators/11836
R1R2S2is included in the above product. For details, please see the article below on the Investment Navi+ site.
Indicator “R1R2S2” released to aim for trend reversal, buy the dip, and sell the rally with 3 RCI lines (2-stage confirmation)
(https://www.gogojungle.co.jp/finance/navi/articles/61588)
Also,R1R2S2uses a PDF (methods・case studies) added as appropriate. For details, please see the article below on the Investment Navi+ site.
PDF collection to effectively use R1R2S2【Master RCI and win!!】
(https://www.gogojungle.co.jp/finance/navi/articles/93154)
Below,mBDSR (RCI Two-Lines Filter) and R1R2S2 are shown with signals displayed simultaneously.
GBPUSD 5-minute chart
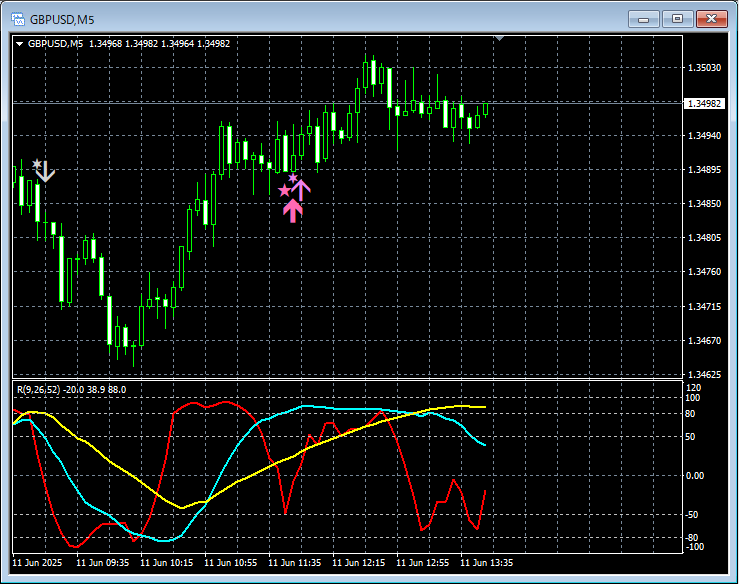
mBDSR (RCI Two-Lines Filter) and R1R2S2 signals
On the 5-minute chart above,R1R2S2 Sell-back signal fired and after the drop, the trend reversed and rose.mBDSR (RCI Two-Lines Filter) Buy-the-Dip signal →R1R2S2 Buy-the-Dip signal fired in order and continued higher.
Using the three RCI lines to cascade from higher timeframe to lower timeframe,wait for the mBDSR signals to appear,and when the mBDSR signal does not light up or you miss the signal or are late,you can sometimes rely on the R1R2S2 signal,andR1R2S2 is often used together withmBDSR.An indicator that excels when combined with RCI【BODSOR・mBDSR】Methods and case studies (PDF) ★GogoJungle AWARD2020 winner★https://www.gogojungle.co.jp/tools/indicators/11836The PDF file includes 358 files (over 1,400 pages, over 470,000 characters).Most of them arecollections that detail using the three-RCI-line approach to logically link higher and lower timeframes, examining multiple lower-timeframe conditions in sequence, ultimately waiting for buying the dip or selling the rally timing (i.e., mBDSR signals) on the lower timeframes.Also,many focus on identifying points where multiple entry reasons align..Additionally,there are methods to explore upside and downside targets using the three-RCI-line approach.In the PDF explanations,more than 1,350 charts are used.you can sometimes rely on the R1R2S2 signal,andR1R2S2 ismBDSR often used together with.
An indicator that excels when combined with RCI【BODSOR・mBDSR】
Methods and case studies (PDF) ★GogoJungle AWARD2020 winner★
https://www.gogojungle.co.jp/tools/indicators/11836
The PDF file includes 358 files (over 1,400 pages, over 470,000 characters).
Most of them arecollections that detail using the three-RCI-line approach to logically link higher and lower timeframes, examining multiple lower-timeframe conditions in sequence, ultimately waiting for buying the dip or selling the rally timing (i.e., mBDSR signals) on the lower timeframes.
Also,many focus on identifying points where multiple entry reasons align..
Additionally,there are methods to explore upside and downside targets using the three-RCI-line approach.
In the PDF explanations,more than 1,350 charts are used.

× ![]()


