

Master RCI to the utmost!! Note: The content within the original HTML, including the bracketed Japanese phrase and trading pair, has been translated while preserving the overall HTML structure.
========================================
↓↓↓ This is a recommendation of free articles.
[Comprehensive Edition] USD/JPY Analysis Example
(Signals of RCI with candlestick patterns, moving averages, chart patterns, mBDSR, and R1R2S2)
https://www.gogojungle.co.jp/finance/navi/articles/90838
========================================
[Master RCI!! Trend Reversal, Buy the Dip, Sell the Rallies]
Indicator that shows great power in combination with RCI【BODSOR・mBDSR】
and Methodologies & Case Studies (PDF) ★GogoJungle AWARD2020 Recipient★
https://www.gogojungle.co.jp/tools/indicators/11836
R1R2S2is included in the above product. For details, please read the article below in 投資ナビ+ (Investment Navigator+).
RCI three-line ‘Two-Stage Judgment’ to target trend reversals, buying dips, and selling rallies: R1R2S2 release!!
(https://www.gogojungle.co.jp/finance/navi/articles/61588)
Also,R1R2S2is supported by PDF (methods & case studies) which are added as needed. For details, please see the article below in 投資ナビ+.
PDF collection for effectively using R1R2S2【Mastering RCI to Win!!】
(https://www.gogojungle.co.jp/finance/navi/articles/93154)
Below, we introduce examples ofR1R2S2signs.
GBPUSD 30-minute chart
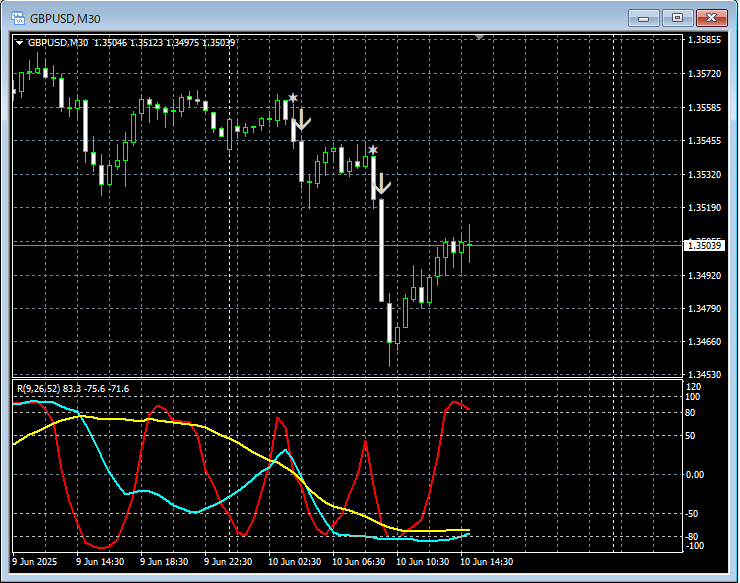
R1R2S2signs
In the 30-minute chart above,R1R2S2reversal/rally selling signals light up at the right timing.
Using the three RCI linesto break down from higher to lower time frames,mBDSR signalsare brought to a state where they can light up,mBDSR signalsdid not light up, or were missed or delayed,R1R2S2signals can sometimes be used to respond,R1R2S2andmBDSRare often used in conjunction.
Indicator that shows power in combination with RCI【BODSOR・mBDSR】
and Methodologies & Case Studies (PDF) ★GogoJungle AWARD2020 Recipient★
https://www.gogojungle.co.jp/tools/indicators/11836
The PDF file contains 358 items (over 1,400 pages, over 470,000 characters).
Many of them areexamples that link the higher-timeframe and lower-timeframe logically by using the RCI three-line, then sequentially consider multiple lower-timeframe conditions, ultimately waiting for buying on dips or selling on rallies (i.e., mBDSR signals)..
Also,many focus on identifying points where multiple entry reasons overlap..
Additionally,there are methods to explore upside and downside targets using the RCI three lines..
In the PDF explanations,more than 1,350 chartsare used.

× ![]()


