

Use both signs of the mBDSR (RCI2本フィルター) and the signs of R1R2S2 (16) USD/JPY
=================
↓↓↓ This is a recommended free article.
[Preservation Edition] USD/JPY Analysis Example
(Signals of RCI, Japanese candlestick patterns, moving averages, chart patterns, mBDSR, and R1R2S2)
https://www.gogojungle.co.jp/finance/navi/articles/90838
=================
【Mastering RCI!! Trend Reversal, Buy on Dip, Sell on Rally】
Indicator that shines in combination with RCI: 【BODSOR・mBDSR】
and methods・case studies (PDF) ★GogoJungle AWARD 2020 Winner★
https://www.gogojungle.co.jp/tools/indicators/11836
R1R2S2is included in the above product. For details, please see the article below in the Investment Navigator+.
RCI 3-line “Two-stage Judgment” to Aim for Trend Reversal, Buy on Dip, Sell on Rally: R1R2S2 Release!!
(https://www.gogojungle.co.jp/finance/navi/articles/61588)
Also,R1R2S2uses a PDF (methods・case studies) added as needed. For details, please see the article below in the Investment Navigator+.
PDF collection to effectively use R1R2S2【Master RCI and Win!!】
(https://www.gogojungle.co.jp/finance/navi/articles/93154)
Below,mBDSR (RCI two-filter) andR1R2S2signals are shown simultaneously as an example.
USDJPY – 30-minute chart
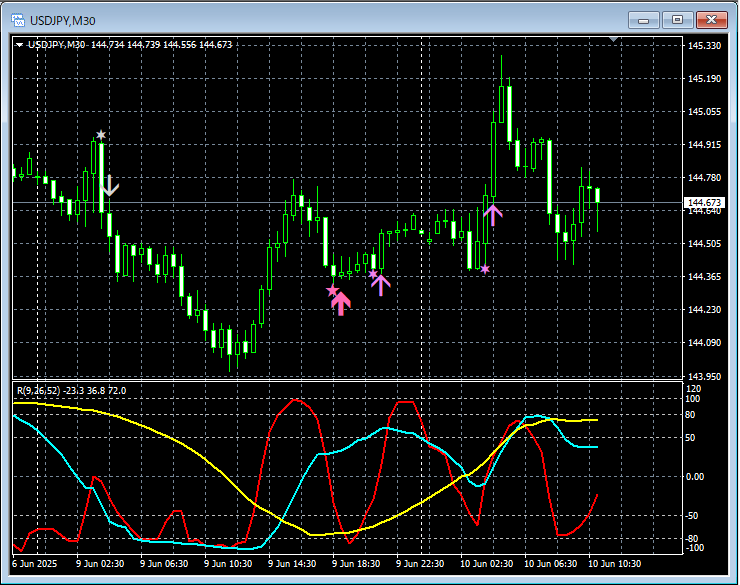
mBDSR (RCI two-filter)andR1R2S2
On the 30-minute chart above,R1R2S2’s sell-the-rally signallights up and falls. During the subsequent rise,the buy-the-dip signal of mBDSR (RCI two-filter)appears once,the buy-the-dip signal of R1R2S2appears twice.
Using the RCI three-lineto filter from higher to lower timeframes,wait for the signals of mBDSRto illuminate,and if the mBDSR signaldoes not illuminate, or you miss it, or are late,R1R2S2signals can sometimes be used to respond, andR1R2S2mBDSR.
Indicator that shines in combination with RCI【BODSOR・mBDSR】
and methods・case studies (PDF) ★GogoJungle AWARD2020 Winner★
https://www.gogojungle.co.jp/tools/indicators/11836
The PDF file includes 358 items (over 1,400 pages, over 470,000 characters).
Many of them aresummaries of how to logically link higher and lower timeframes using the RCI 3-line, so as to sequentially analyze the statuses of multiple lower timeframes and finally wait for the timing of a dip or rally (i.e., the mBDSR signal) on the lower timeframes.
Also,many entries emphasize identifying points where multiple entry premises converge.
Additionally,there are methods for exploring upside targets and downside targets using the RCI 3-line.
In the PDF explanations,more than 1,350 chartsare used.

× ![]()


