

Achieve Mastery of RCI!! Utilize the Signs of R1R2S2 (10) Euro/Australia Dollar
===============================
↓↓↓ Free recommended articles.
[Comprehensive Edition] USD/JPY Analysis Example
(Signals from the RCI, candlestick patterns, moving averages, chart patterns, mBDSR, and R1R2S2)
https://www.gogojungle.co.jp/finance/navi/articles/90838
===============================
【Master RCI!! Trend Reversal, Buy on Dips, Sell on Rallies】
Indicators that shine in combination with RCI: 【BODSOR・mBDSR】
and methods, case studies (PDF) ★GogoJungle AWARD2020 winner★
https://www.gogojungle.co.jp/tools/indicators/11836
R1R2S2is included in the above product. For details, please see the following Investment Navi+ article.
RCI three-line “Two-stage Confirmation” to target trend reversals, buy on dips, and sell on rallies! R1R2S2 released!!
BelowR1R2S2sign examples will be introduced.
EUR/AUD 1-minute chart
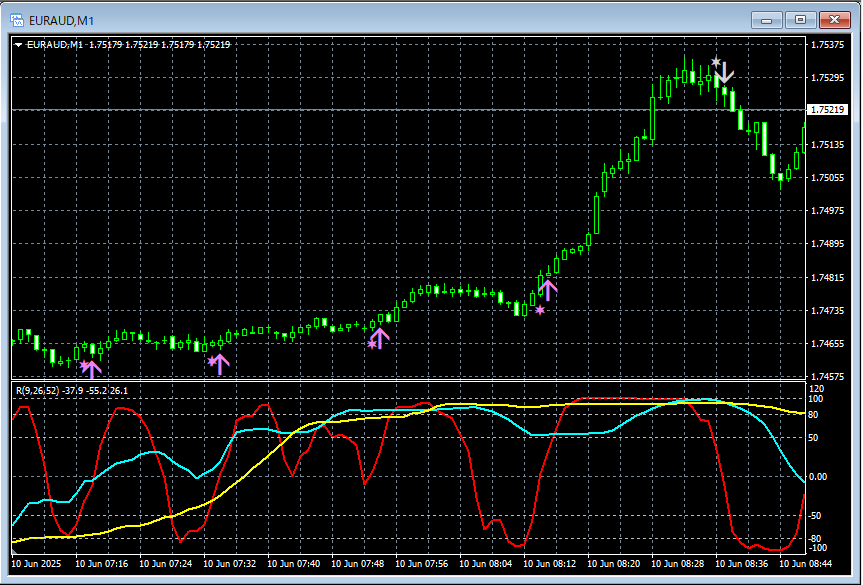
R1R2S2signs
On the above 1-minute chart,R1R2S2 signsfor dip buys and rally sells light up in a timely manner.
RCI three-lineis used to break down from higher to lower time frames,wait for the mBDSR signalsto light up,when the mBDSR signalsdo not light up, or when missed or delayed,R1R2S2 signscan be used to respond, andR1R2S2is often used in conjunction withmBDSR.
Indicators that shine in combination with RCI: 【BODSOR・mBDSR】
and methods, case studies (PDF) ★GogoJungle AWARD2020 winner★
https://www.gogojungle.co.jp/tools/indicators/11836
The PDF file includes 358 items (over 1,400 pages, over 470,000 words).
Most of these areexamples that document how to logically link higher and lower time frames using the three-line RCI, sequentially analyze multiple lower time frames, and finally wait for dip buys or rallies timing (i.e., mBDSR signals) on the lower time frame.
Additionally,many are focused on capturing points where multiple entry rationale coincide.
Also,there is also a method to explore upside and downside targets using the three-line RCI..
In the PDF explanations,more than 1,350 chartsare used.

× ![]()


