

Utilize both the sign of the mBDSR (RCI2 本フィルター) and the sign of R1R2S2 (15) Dollar/Yen
=================================
↓↓↓ Free recommended article.
[Ultimate Guide] USDJPY Analysis Example
(Signals of RCI, candlestick patterns, moving averages, chart patterns, mBDSR, and R1R2S2)
https://www.gogojungle.co.jp/finance/navi/articles/90838
=================================
[Mastering RCI!! Trend Reversal, Buy on Dips, Sell on Rallies]
Indicator that shines in combination with RCI: [BODSOR・mBDSR]
Methods, and Case Studies (PDF) ★GogoJungle AWARD2020 winner★
https://www.gogojungle.co.jp/tools/indicators/11836
R1R2S2is included in the above product. For details, please see the investment navigator + article below.
RCI 3-line 'Two-stage Confirmation' to target Trend Reversal, Buy on Dips, and Sell on Rallies: R1R2S2 released!!
Below,mBDSR (RCI two-line filter)andR1R2S2
USDJPY five-minute chart
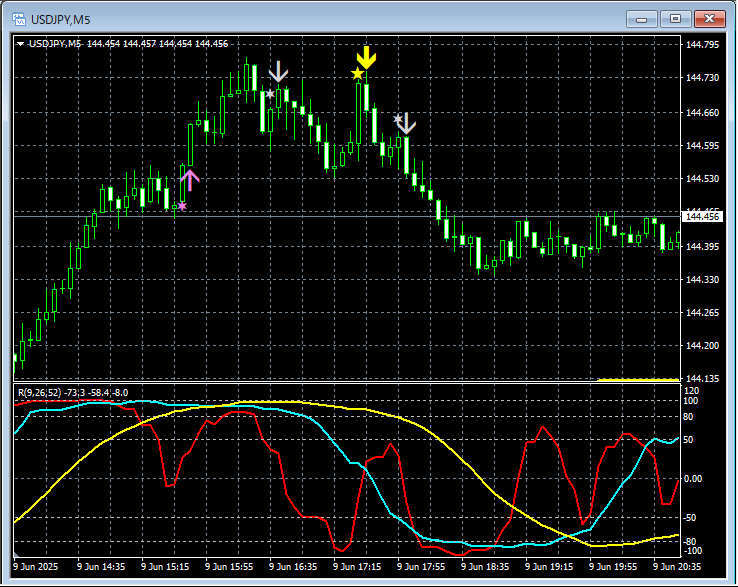
mBDSR (RCI two-line filter)andR1R2S2signs
In the above 5-minute chart,R1R2S2 Buy on Dip signallights up and price rises. ThenR1R2S2 Sell on Rally signalandmBDSR (RCI two-line filter) Sell on Rally signallight up and price falls. Also,mBDSR Sell on Rally signallights up once more after lighting,R1R2S2 Sell on Rally signallights up again.
Using the RCI 3-lineto drill down from higher timeframes to lower timeframes,bring the mBDSR signalssigns are shown simultaneously as an example.to a state where you wait for the signals to light up,when the mBDSR signaldoes not light up, or you miss or are late to it,the R1R2S2 signalmay be used to respond, andR1R2S2is often used in conjunction withmBDSR.
Indicator that shines in combination with RCI【BODSOR・mBDSR】
and methods & case studies (PDF) ★GogoJungle AWARD2020 winner★
https://www.gogojungle.co.jp/tools/indicators/11836
The PDF file contains 358 files (over 1,400 pages, over 470,000 words).
Many of them areexamples that examine the situations of multiple lower timeframes by logically linking the higher timeframe with the lower timeframe using the RCI 3-line, and ultimately waiting for the dip-buying or rally-selling signals (i.e., the mBDSR signals) on the lower timeframes..
In addition,there are many that focus on identifying points where multiple entry signals coincide..
Note thatthere are also methods that explore upside and downside targets using the RCI 3-line..
In the PDF descriptions,more than 1,350 chartsare used.

× ![]()


