

Use both the sign of mBDSR (RCI2 low-pass filter) and the sign of R1R2S2 (14) Swiss franc to yen
================================
↓↓↓ Free recommended articles.
[Preserved Edition] USD/JPY Analysis Example
(Signals of RCI with candlestick patterns, moving averages, chart patterns, mBDSR, and R1R2S2)
https://www.gogojungle.co.jp/finance/navi/articles/90838
================================
[Mastering RCI!! Trend Reversal, Bargaine Dip Buying, Comeback Selling]
Indicator that shines when combined with RCI: [BODSOR・mBDSR]
Methods and case studies (PDF) ★GogoJungle AWARD2020 winner★
https://www.gogojungle.co.jp/tools/indicators/11836
R1R2S2is included in the above products. For details, please see the following Investment Navi+ article.
RCI three-line release of the indicator “R1R2S2” to target trend reversals, dip buys, and pullback sells with a two-stage check!!
Below,mBDSR (RCI two-line filter)andR1R2S2signs are shown simultaneously in an example.
Swiss Franc Yen CHFJPY 1-hour chart
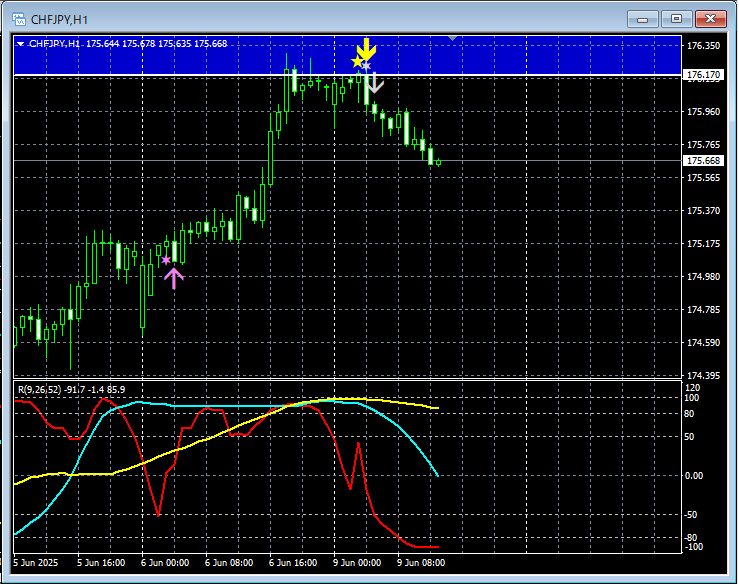
mBDSR (RCI two-line filter)andR1R2S2signs
In the 1-hour chart above,R1R2S2 dip-buying signallights upResistance zoneand rises. ThenmBDSR (RCI two-line filter) pullback selling signallights up and declines. Also,mBDSR (RCI two-line filter) pullback selling signallights up immediately afterR1R2S2 pullback selling signallights up as well.
Using the three RCI linesto filter from higher to lower timeframes,waiting for the mBDSR signalto light up,and if the mBDSR signaldoes not light up or you miss it or are late,the R1R2S2 signalmay be used to respond in some cases,and R1R2S2is often used in conjunction withmBDSR.
Indicator that shines when combined with RCI: [BODSOR・mBDSR]
Methods and case studies (PDF) ★GogoJungle AWARD2020 winner★
https://www.gogojungle.co.jp/tools/indicators/11836
The PDF file contains 358 items (over 1,400 pages, over 470,000 characters in total).
Most of them areexamples that break down how multiple lower-timeframe conditions are logically linked using three RCI lines, ultimately waiting for the timing of dip buying or pullback selling on the lower timeframes (i.e., the mBDSR signals)..
Additionally,many focus on identifying points where multiple entry signals overlap..
Also included is a method to explore upside targets and downside targets using the three RCI lines.
In the PDF explanations,more than 1,350 chartsare used.

× ![]()


