

[Master RCI to Win with Moving Average Filter!! GBPJPY 1-hour chart] mBDSR's Buy-the-Dip Signal
===============================
↓↓↓ This is a recommended free article.
[Comprehensive Edition] USD/JPY Analysis Example
(RSI and candlestick patterns, moving average lines, chart patterns, mBDSR and R1R2S2 signals)
https://www.gogojungle.co.jp/finance/navi/articles/90838
===============================
[Mastering RCI to Win!! Trend Reversal, Buy-the-Dip, Sell-the-Rally]
Indicator that shines in combination with RCI: [BODSOR・mBDSR]
and Methodology & Case Studies (PDF) ★GogoJungle AWARD2020 Winner★
https://www.gogojungle.co.jp/tools/indicators/11836
The PDF file includes 358 items (over 1,400 pages, over 470,000 characters) attached.
mBDSR (RCI filter)andmBDSR (Moving Average Filter)play different roles. The distribution between these uses is also discussed in the attached PDF.
Below we presentthe signs of mBDSR (Moving Average Filter)with examples.
GBPJPY 1-hour chart
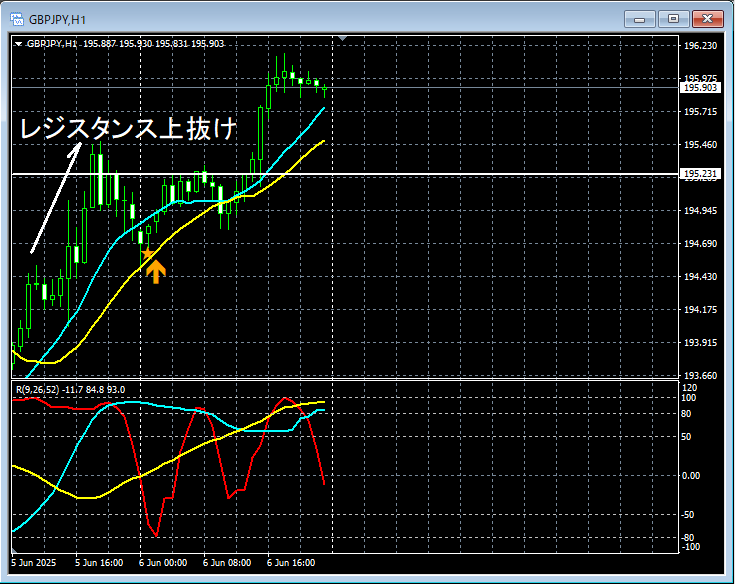
In the 1-hour chart above,resistance lineis broken and then pulled backmBDSR (Moving Average Filter)buy-the-dip signal lights up in time.
In the case of the Moving Average Filter mBDSRas well,by integrating with RCI’s three-line setup from higher to lower timeframesa high-probability trade becomes possible. This is also explained in theattached PDF.
Note: The charts introduced in this article may include circles, straight lines, and squares for readability.
Indicator that shines in combination with RCI【BODSOR・mBDSR】
and Methodology & Case Studies (PDF) ★GogoJungle AWARD2020 Winner★
https://www.gogojungle.co.jp/tools/indicators/11836
The PDF file includes 358 items (over 1,400 pages, over 470,000 characters).
Many of these areexamples that link higher and lower timeframes logically using three-line RCI, sequentially examining multiple lower-timeframe conditions, and ultimately waiting for a dip or rally timing (i.e., mBDSR signals) on the lower timeframe..
Also,there are many pieces that emphasize identifying points where multiple entry reasons overlap..
Additionally,there are methods for exploring potential upside and downside targets using three-line RCI..
In the PDF explanations,more than 1,350 chartsare used.

× ![]()


