

Excel at RCI to the fullest!! mBDSR's RCI filter and moving average filter (1)
=====================
【Free Indicator Information】
This is an introduction to an MT4 indicator that displays three RSI lines not in a sub-window but in themain windowof MT4.
【Free】 Indicator that displays three RSI lines in MT4's main window
https://www.gogojungle.co.jp/tools/indicators/62950
=====================
【Master RSI to Win!! Trend Reversal, Buy the Dip, Sell the Rally】
Indicator that combines with RCI for greater power: 【BODSOR・mBDSR】
and methods & case studies (PDF) ★GogoJungle AWARD2020 winner★
https://www.gogojungle.co.jp/tools/indicators/11836
The PDF file comes with 358 items (over 1,400 pages, over 470,000 characters).
mBDSR (RCI filter)andmBDSR (Moving Average filter)have different roles. The usage distinctions are also covered in the included PDF.
Below,mBDSR (RCI filter)andmBDSR (Moving Average filter)will be shown on charts displaying signals from both filters.
CADJPY 4-hour chart
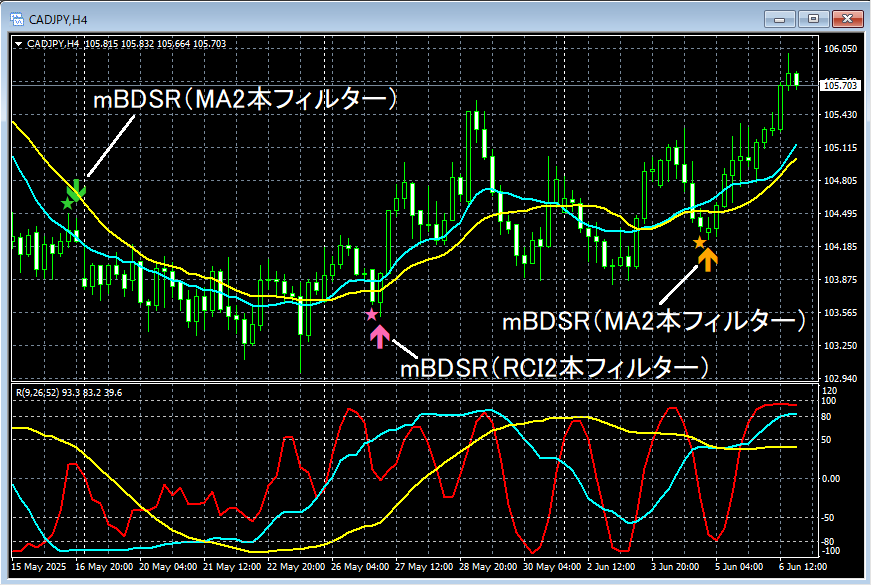
In the 4-hour chart above,the selling signal from the moving average filter of mBDSR→the dip-buying signal from the two-RCI filter of mBDSR→the dip-buying signal from the moving average filter of mBDSRappears in timely succession.
When using the Moving Average Filter mBDSR,the downscaling from higher to lower timeframes using the three RCI linesin combination can enable high-profit trades. This is alsoexplained in the included PDF.
※ Please note that in charts described here, for convenience of explanation, circles, lines, and rectangles may have been added.
Indicator that excels when combined with RCI: 【BODSOR・mBDSR】
and methods & case studies (PDF) ★GogoJungle AWARD2020 winner★
https://www.gogojungle.co.jp/tools/indicators/11836
The PDF file includes 358 items (over 1,400 pages, over 470,000 characters).
Many of themdocument how to logically link higher and lower timeframes using the three RSI lines, sequentially analyzing multiple lower-timeframe conditions, and ultimately waiting for dip-buy signals or pullback signals on the lower timeframes (i.e., mBDSR signals)..
Additionally,there is a focus on capturing points where multiple entry reasons overlap..
Furthermore,the method to explore upside and downside targets using three RSI lines is also included..
In the PDF explanations,more than 1,350 chartsare used.

× ![]()


