

【Master RCI!! Latest Bitcoin 20250606】Double top neckline and mBDSR signal BTCUSD
========================================
【Free Indicator Information】
This introduces an MT4 indicator that displays three RCI lines in theMain Windowinstead of a sub-window.
【Free】 Indicator that shows three RCIs in MT4's main window
https://www.gogojungle.co.jp/tools/indicators/62950
========================================
【Mastering RCI!! Trend Reversal, Buy on Dips, Sell on Rises】
An indicator that shines when combined with RCI【BODSOR・mBDSR】
and methods & case studies (PDF) ★GogoJungle AWARD2020 Winner★
https://www.gogojungle.co.jp/tools/indicators/11836
Bitcoin/USD BTCUSD 4-hour chart
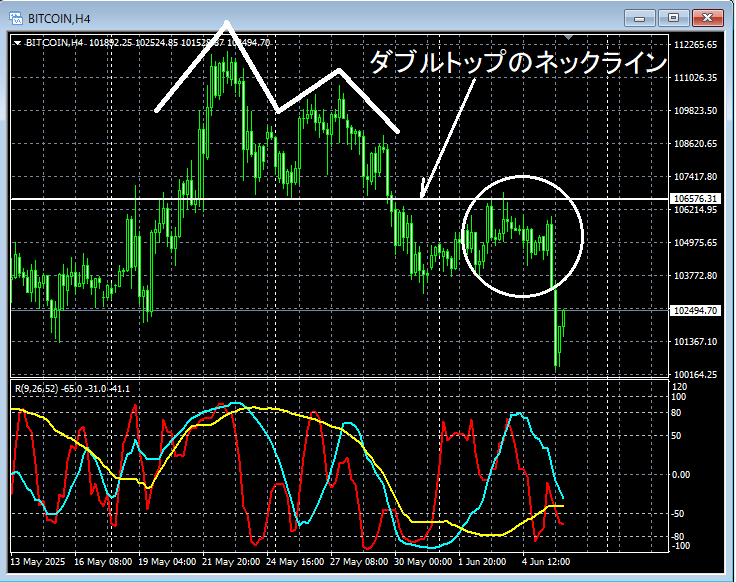
In the above 4-hour chart,a Double Topis formed and price is dropping.Necklinenear which (around the area enclosed by the white circle) we will examine in detail on the lower time frame of 1 hour.
Bitcoin/USD BTCUSD 1-hour chart
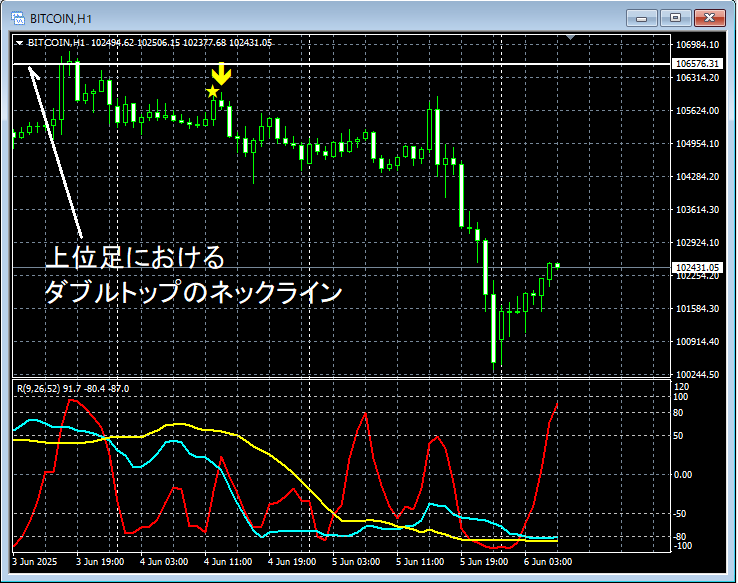
mBDSR (Two RCI filter)signal
In the above 1-hour chart, firstDouble Topreaches near theNecklineand then turns down. Subsequently,mBDSR (Two RCI filter) pullback sell signallights up and the price clearly declines.
An indicator that shines when combined with RCI【BODSOR・mBDSR】
and methods & case studies (PDF) ★GogoJungle AWARD2020 Winner★
https://www.gogojungle.co.jp/tools/indicators/11836
The PDF file includes 358 items (over 1,400 pages, over 470,000 characters).
Many of them describe how to logically link higher and lower timeframes using three RCI lines, sequentially considering the conditions of multiple lower timeframes, and ultimately waiting for pullbacks in lower timeframes (i.e., mBDSR signals) for entry.

× ![]()


