

[Mastering RCI!! Today's USD/JPY 15-minute chart 20250605] Signals for Double Top, Return High, Resistance Line, and mBDSR and R1R2S2
=========================================
【Free Indicator Information】
This is an introduction to an MT4 indicator that displays three RCI on the main window instead of a subwindow.
【Free】 Indicator that displays three RCIs on MT4's main window
https://www.gogojungle.co.jp/tools/indicators/62950
=========================================
【Mastering RCI!! Trend Reversal, Buy on Dips, Sell on Rallies】
An indicator that shines when combined with RCI: 【BODSOR・mBDSR】
Methods and case studies (PDF) ★GogoJungle AWARD2020 Winner★
https://www.gogojungle.co.jp/tools/indicators/11836
USDJPY 15-minute chart
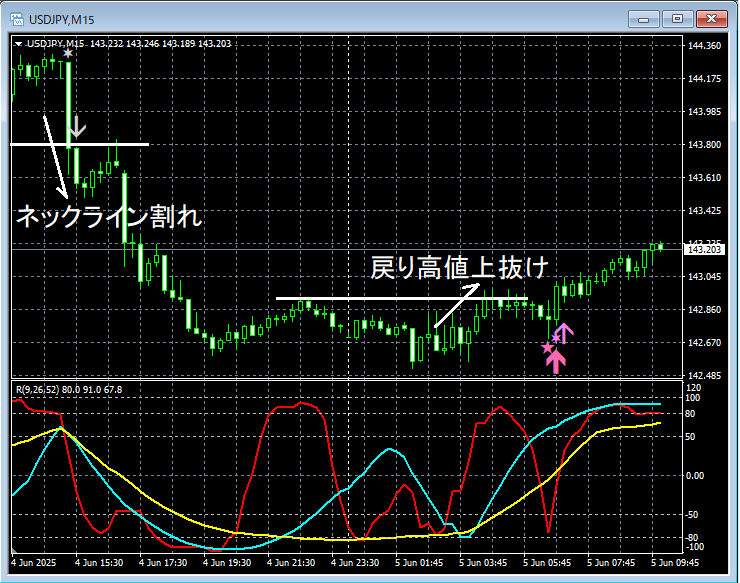
mBDSR (RCI two-line filter)signals andR1R2S2signals
In the above 15-minute chart, firsta double topnecklineis broken downward,R1R2S2reversal signals light up and the price continues to fall. Thenthe breakout above the previous highis followed by a declinewith the mBDSR (RCI two-line filter) buy-the-dip signallighting up, and furtherR1R2S2 buy-the-dip signalslight up and the price moves higher.
An indicator that shines when combined with RCI: 【BODSOR・mBDSR】
Methods and case studies (PDF) ★GogoJungle AWARD2020 Winner★
https://www.gogojungle.co.jp/tools/indicators/11836
The PDF file includes 358 files (over 1,400 pages, over 470,000 characters).
Many of them describehow to logically link higher and lower timeframes using the three-line RCI, examining multiple lower-timeframe situations step by step, and ultimately waiting for dip-buying or rally-selling timing (i.e., mBDSR signals) on the lower timeframesas examples.
Also,there are many that focus on capturing points where multiple entry reasons overlap..
In addition,there are methods that explore upward and downward targets using the three-line RCI..
In the PDF descriptions,more than 1,350 chartsare used.

× ![]()


