

[Mastering RCI!! Yesterday's USD/JPY 1-hour chart 20250603] Trendline, Resistance Line, and mBDSR signals
===============================================
【Free Indicator Information】
This is an introduction to an MT4 indicator that displays three RCI on the main window, not in a subwindow.Main Window
【Free】 Indicator that displays three RCIs in MT4's main window
https://www.gogojungle.co.jp/tools/indicators/62950
===============================================
【Master RCI!! Trend Reversal, Buy on Dips, Sell on Rallies】
An indicator that shines in combination with RCI: 【BODSOR・mBDSR】
Methods and case studies (PDF) ★GogoJungle AWARD2020 Winner★
https://www.gogojungle.co.jp/tools/indicators/11836
USDJPY / Dollar-Yen / 1-hour chart
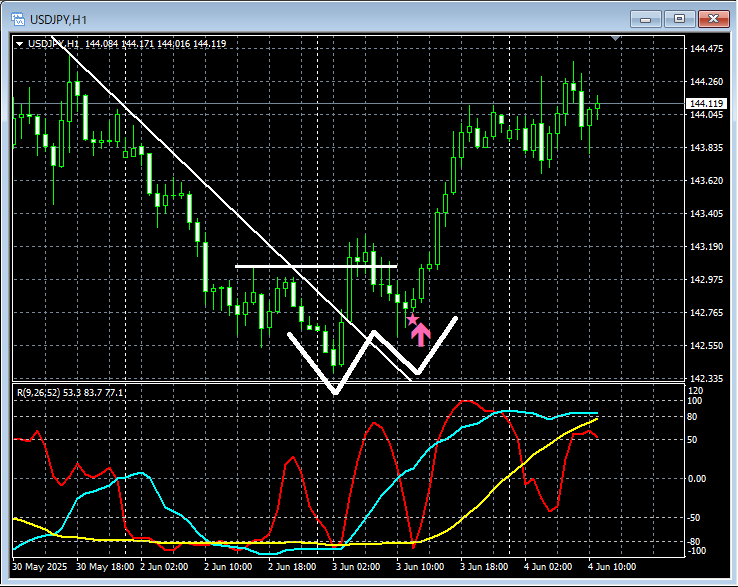
mBDSR (RCI two-filter)Signal
On the 1-hour chart above, firsttrend lineis pierced upward,resistance lineis pierced upward, and then as it declinesmBDSR (RCI two-filter) dip-buy signallights up and rises significantly. This can be said to be a dip-buy signal that lights up after the downward momentum weakens.
Additionally, as a resultdouble bottomthe timing of the rise at the rightmost trough iscaught well by the mBDSR (RCI two-filter) dip-buy signal.
An indicator that shines in combination with RCI:【BODSOR・mBDSR】
Methods and case studies (PDF) ★GogoJungle AWARD2020 Winner★
https://www.gogojungle.co.jp/tools/indicators/11836
The PDF file contains 358 items (over 1,400 pages, over 470,000 characters).
Many of themare examples that summarize how to logically link higher and lower timeframes using three RCI lines to analyze multiple lower timeframes sequentially and ultimately wait for dip-buy or rally-sell timings on the lower timeframe (i.e., the signal of mBDSR)..
Also,many are focused on capturing points where multiple entry signals overlap..
In addition,there is a method for exploring upside and downside targets using three RCIs..
In the PDF explanations,there are over 1,350 charts used..

× ![]()


