

About seven sign-on activations within roughly 4 and a half hours, “RCI three-line + mBDSR” (USD/JPY 1-minute chart) 20181228
※Campaign is ongoing until January 10, 2019.
BODSOR (mBDSR)sales pagehere.
※ BODSOR and mBDSR are indicators developed to enhance the entry precision when applying pullback buying or pullback selling using the RCi 3-line.
The figure below is a 1-minute chart of USD/JPY.
USD/JPY 1-minute chart (December 28, 2018)
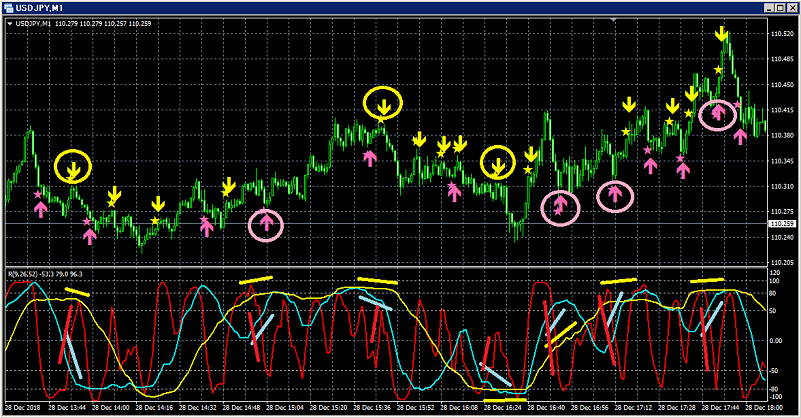
Top: mBDSR
(1) About four and a half hours of pullback selling signals (yellow arrows circled in circle) illuminated about three times
Among the three RCi lines, only RCI9 clearly rises.
If RCI9 reverses downward, all three RCi lines may turn down.
That is, price may also undergo a strong decline.
In such scenarios,mBDSR pullback selling signals (yellow arrows circled) light up.
(2)About four and a half hours of pullback buying signals (pink arrows circled in circle) appeared about four times
Among the three RCi lines, only RCI9 clearly falls.
If RCI9 reverses upward, all three RCi lines may rise together.
That is, price may also undergo a strong rise.
In such scenarios,mBDSR pullback buying signals (pink arrows circled in pink) light up.
BODSOR (mBDSR) sales page is here.

https://twitter.com/RCIX3Line
Blog
http://bodsor.blog.fc2.com/
Investment Navigator Plus
https://fx-on.com/navi/serial/?id=359
YouTube
https://www.youtube.com/channel/UCL-g5uAlesiWVJEDtWlFvGw
An example of pullback buying and pullback selling signals on USD/JPY 1-hour chart
※Note: In charts within this article, for convenience of explanation, circles, straight lines, and squares may be drawn in various places. Please understand.


