

【Master RCI and Win with a Moving Average Filter!! USD/JPY 1-Hour】mBDSR’s Rebound Sell Signal
===================================================
【Free Indicator Information】
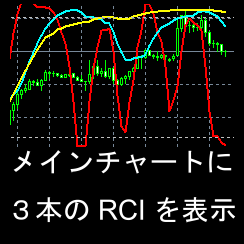
This is an introduction to an MT4 indicator that displays three RCI lines in the main window, not in a sub-window.Main Window display in the MT4 main window.
【Free】 An indicator that displays three RCIs in the MT4 main window
https://www.gogojungle.co.jp/tools/indicators/62950
===================================================
【Master RCI to Win!! Trend Reversal, Buy on Dips, Sell on Rallies】
An indicator that shines when combined with RCI【BODSOR・mBDSR】
and methods & case studies (PDF) ★GogoJungle AWARD2020 winner★
https://www.gogojungle.co.jp/tools/indicators/11836
The PDF file includes 358 items (over 1,400 pages, over 470,000 words).
mBDSR (RCI Filter)andmBDSR (Moving Average Filter)have different roles. The differences in usage are also addressed in the accompanying PDF.
Below,mBDSR (Moving Average Filter)sign examples are introduced.
USD/JPY 1-hour
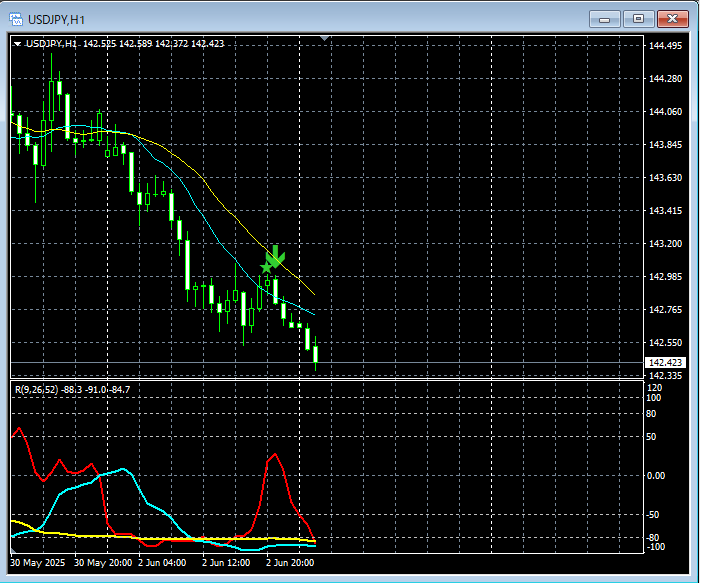
In the hourly chart above,mBDSR (Moving Average Filter)sell-rallies signal lights up at the right timing.
When using the Moving Average Filter with mBDSR,by combining with the three-line RCI from higher to lower timeframesyou can achieve trades with high edge. This area is also explained in theaccompanying PDF.
※ Please note that for convenience in this article's charts, circles, lines, and boxes may be drawn.
An indicator that shines when combined with RCI【BODSOR・mBDSR】
and methods & case studies (PDF) ★GogoJungle AWARD2020 winner★
https://www.gogojungle.co.jp/tools/indicators/11836
The PDF file includes 358 items (over 1,400 pages, over 470,000 words).
Most of these are examples that lay out a logical linking of higher and lower timeframes using the three RCI lines, sequentially considering multiple lower timeframes, and ultimately waiting for pullbacks in the lower timeframe (i.e., mBDSR signals) for entries.
Also,many of these emphasize identifying points where multiple entry signals overlap..
Additionally,there are methods for exploring upside and downside targets using the three-line RCI..
In the PDF explanations,more than 1,350 chartsare used.

× ![]()


