

[Master RCI to Win Greatly!!] Break of Support and mBDSR Return-Sell Signal (2) USD/JPY 5-minute Chart 2025/6/2
=====================
【Free Indicator Information】
This is an MT4 indicator that displays three RCI lines not in a sub-window butin the main window.
【Free】 Indicator that displays three RCIs in MT4's main window
https://www.gogojungle.co.jp/tools/indicators/62950
=====================
【Master RCI to Win!! Trend Reversal, Buy on Dips, Sell on Rallies】
Indicator that excels when combined with RCI【BODSOR・mBDSR】
and its methods and case studies (PDF) ★GogoJungle AWARD2020 winner★
https://www.gogojungle.co.jp/tools/indicators/11836
The PDF file contains 358 files (over 1,400 pages, over 470,000 characters in total).
Fall below the support priceandmBDSR’s Sell-Expecting signalExample has been discussed multiple times inInvestor Navi+ articlesand we plan to continue featuring it in the future.
USD/JPY 15-minute chart
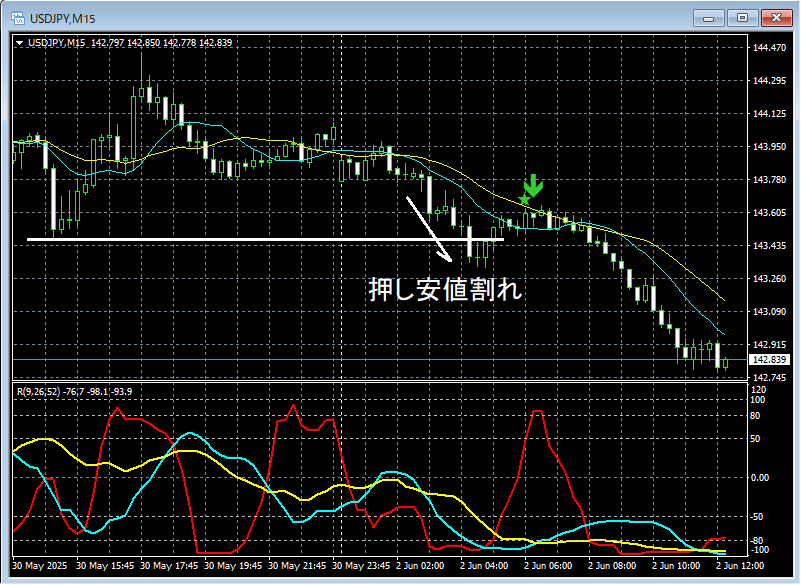
On the above 15-minute chart,after breaking the support pricethe rise is met withmBDSR (RCI 2-line filter) sell signallighting up, and the price declines.
Because the uptrend is temporarily negated by breaking the support price, this indicates there is one more selling justification compared to just a sell signal lighting up.
From this example,a trading method focusing on Dow Theoryandthe signal from mBDSRshow strong compatibility.
※In the charts introduced in this article, for ease of explanation, circles, lines, and rectangles may be drawn, so please understand.
Indicator that excels when combined with RCI【BODSOR・mBDSR】
and its methods and case studies (PDF) ★GogoJungle AWARD2020 winner★
https://www.gogojungle.co.jp/tools/indicators/11836
The PDF file contains 358 files (over 1,400 pages, over 470,000 characters in total).
Many of them areexamples that logically link higher and lower timeframes using the three-line RCI to sequentially study multiple lower-timeframe conditions, ultimately waiting for a dip buying or pullback selling timing (i.e., mBDSR signals) on the lower timeframes..
Also,there are many that emphasize identifying points where multiple entry reasons coincide..
Additionally,there are methods that explore potential upside and downside using the three-line RCI..
In the PDF explanations,over 1,350 chartsare used.

× ![]()


