

Pound-Dollar 1-hour Timeframe Buy-the-Dip Signal [RCI 3-Line + mBDSR] 20181228
※Campaign is ongoing until January 10, 2019.
BODSOR (mBDSR)sales page ishere.
※ BODSOR and mBDSR are indicators developed to improve entry accuracy when using three-line RCIs for buying on dips or selling on rallies.
The figure below is a 1-hour chart of the GBP/USD.
GBP/USD 1-hour chart (December 24–28, 2018)
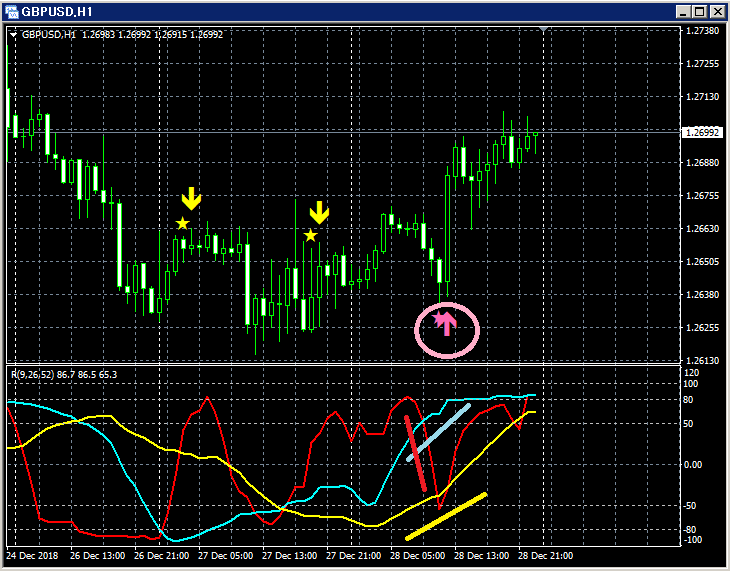
Top row:mBDSR
Bottom row: three RCI lines (Red: RCI9, Light blue: RCI26, Yellow: RCI52)
Among the three RCI lines, only RCI9 is clearly turning downward.
If RCI9 reverses and rises, there is a possibility that all three RCIs rise together.
In other words, the price could rise strongly.
In such a situation,mBDSR’s dip-buy signal (pink arrow circled) lights up.
Immediately after the signal lights, a very large bullish candle appears, and afterward also the price rises.
as can be seen
In this example, the reversal of the downward-trending RCI9 confirming rise happens after the big bullish candle appears.
BODSOR (mBDSR) sales page ishere.

Twitter
https://twitter.com/RCIX3Line
Blog
http://bodsor.blog.fc2.com/
Investment Navi+
https://fx-on.com/navi/serial/?id=359
YouTube
https://www.youtube.com/channel/UCL-g5uAlesiWVJEDtWlFvGw
An example of dip-buying and selling on rallies signals on the USD/JPY 1-hour chart
※Note: In this article's charts, for convenience, some lines, squares, and other shapes may have been added. Please understand.


