

Utilize both the sign of mBDSR (RCI2 bandpass filter) and the sign of R1R2S2 (12) EURUSD
================================
↓↓↓ Here are recommended free articles.
[Comprehensive Edition] USDJPY Analysis Example
(Signals of RCI with candlesticks patterns, moving averages, chart patterns, mBDSR and R1R2S2)
https://www.gogojungle.co.jp/finance/navi/articles/90838
================================
[Mastering RCI!! Trend Reversal, Buy on Dip, Sell on Rally]
Indicator that shines when combined with RCI: [BODSOR・mBDSR]
Method & Case Study (PDF) ★GogoJungle AWARD2020 winner★
https://www.gogojungle.co.jp/tools/indicators/11836
R1R2S2is included in the above product. For details, please see the investment navigation + article below.
RCI 3-line “Two-stage Confirmation” to target trend reversals, buying on dips, and selling on rallies — R1R2S2 released!!
Below,mBDSR (RCI two-line filter)andR1R2S2
EUR/USD 5-minute chart
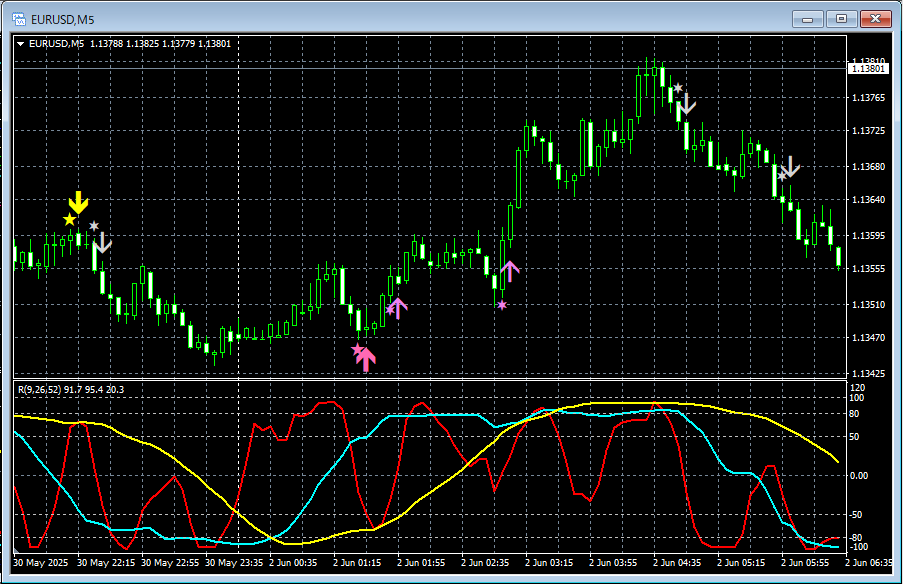
mBDSR (RCI two-line filter)andR1R2S2signs
On the 5-minute chart above,the sell-on-rally signal of mBDSR (RCI two-line filter)→the sell-on-rally signal of R1R2S2→the buy-on-dip signal of mBDSR (RCI two-line filter)→the buy-on-dip signal of R1R2S2→the buy-on-dip signal of R1R2S2→the sell-on-rally signal of R1R2S2→the sell-on-rally signal of R1R2S2is lit in order.
Using the RCI 3-line to descend from higher to lower timeframes,wait for the mBDSR signal illumination,wait for the mBDSR signalto illuminate; if it does not illuminate, or you miss or are late,the R1R2S2 signalcan be used to respond, andR1R2S2isoften used in conjunction withmBDSR.
Indicator that shines with the combination of RCI【BODSOR・mBDSR】
Methods & Case Studies (PDF) ★GogoJungle AWARD2020 winner★
https://www.gogojungle.co.jp/tools/indicators/11836
The PDF file includes 358 documents (over 1,400 pages, over 470,000 characters).
Many of them areexamples that logically link higher and lower timeframes using RCI 3-line to examine multiple lower timeframes sequentially, ultimately waiting for the dip-buys or rally-sells (i.e., mBDSR signals) on the lower timeframe.
Additionally,there are many that focus on capturing points where multiple entry reasons align..
Also included is a method to explore upside targets and downside targets using the RCI 3-line.
In the PDF file explanations,there are over 1,350 charts used..

× ![]()


