

Using both the sign of mBDSR (RCI2 bandpass filter) and the sign of R1R2S2 (10) Gold XAUUSD
=============================================
【Free Indicator Information】
This is an introduction to an MT4 indicator that displays three RCI lines in the main window rather than in a sub-window.Main window
【Free】 Indicator that displays three RCIs in the MT4 main window
https://www.gogojungle.co.jp/tools/indicators/62950
=============================================
【Mastering RCI!! Trend Reversal, Dip Buying, Rebound Selling】
An indicator that shines in combination with RCI: 【BODSOR・mBDSR】
and methods & case studies (PDF) ★GogoJungle AWARD2020 winner★
https://www.gogojungle.co.jp/tools/indicators/11836
R1R2S2is included in the above product. For details, please read the article below in Investment Navigator+.
Three RCIs ‘two-stage confirmation’ to target trend reversals, dip buying, and rebound selling — R1R2S2 released!!
Below,mBDSR (RCI two-line filter)andR1R2S2signs are displayed simultaneously as examples.
Gold XAUUSD 15-minute chart
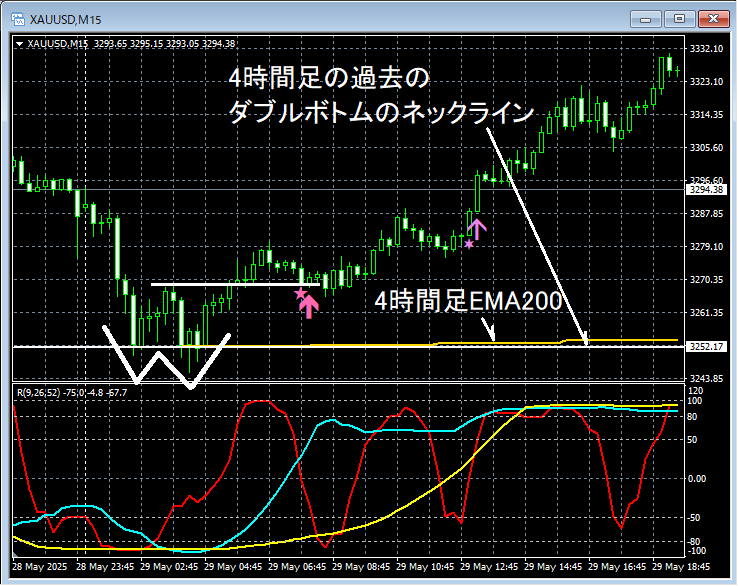
mBDSR (RCI two-line filter)andR1R2S2signs
On the 15-minute chart above,the dip-buying signal of the mBDSR (RCI two-line filter)→the dip-buying signal of R1R2S2lighting up in sequence. The chart has a lot of annotations, but details are omitted.
Using the three RCI linesto filter from higher to lower timeframes,waiting for the mBDSR signalto light up,when the mBDSR signaldoes not light up, or if you miss or are late,the R1R2S2 signalcan sometimes be used as a substitute,R1R2S2isoften used in conjunction withmBDSR
An indicator that shines in combination with RCI:【BODSOR・mBDSR】
and methods & case studies (PDF) ★GogoJungle AWARD2020 winner★
https://www.gogojungle.co.jp/tools/indicators/11836
The PDF file contains 358 files (over 1,400 pages, over 470,000 characters).
Most of them are designed to logically link higher and lower timeframes using the three-RCI-line approach, analyzing multiple lower timeframes in sequence and ultimately waiting for a dip-buy or rebound timing (the mBDSR signal) on the lower timeframe.
In addition,many emphasize identifying points where multiple entry signals overlap.
Also included is a method for exploring price targets for upward and downward moves using the three RCI lines.
The PDF explanations usemore than 1,350 charts.

× ![]()


