

[Master RCI!!] Using the signs of R1R2S2 (6) Dollar/Yen
================================================================================
【Free Indicator Information】
This is an introduction to an MT4 indicator that displays three RCI lines not in a subwindow, but in the main window.
【Free】 Indicator that displays three RCIs in MT4's main window
https://www.gogojungle.co.jp/tools/indicators/62950
================================================================================
【Mastering RCI!! Trend Reversals • Buy on Dips • Sell on Rallies】
An indicator that excels when combined with RCI: 【BODSOR・mBDSR】
and methods / case studies (PDF) ★GogoJungle AWARD2020 winner★
https://www.gogojungle.co.jp/tools/indicators/11836
R1R2S2is included in the above product. For details, please read the following Investment Navi+ article.
RCI three-line “2-step confirmation” to target trend reversals, buy on dips, and sell on rallies – R1R2S2 release!!
Below, we introduce examples of signals forR1R2S2.
USD/JPY – 5-minute chart
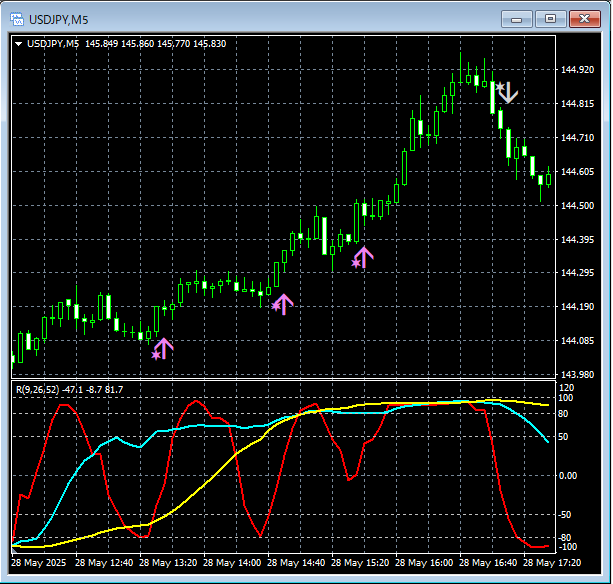
R1R2S2signals
On the above 15-minute chart,R1R2S2 signalsdip-buy and rally-sell signals light up at timely moments.
Using the three-line RCI to drill down from higher to lower timeframes,and waiting for the lights of themBDSR signalsto illuminate,When the mBDSR signal did not light up, or if the signal was missed or delayed,there are cases where you can respond with the R1R2S2 signal,and the R1R2S2is often used together withmBDSR.
An indicator that excels when combined with RCI: 【BODSOR・mBDSR】
and methods / case studies (PDF) ★GogoJungle AWARD2020 winner★
https://www.gogojungle.co.jp/tools/indicators/11836
The PDF file includes 358 items (over 1,400 pages, over 470,000 words).
Many of them are structured to link higher and lower timeframes logically using three-line RCI, so that multiple lower-timeframe conditions are considered sequentially, ultimately waiting for dip-buy timing in the lower timeframes (i.e., mBDSR signals).
Additionally,many focus on capturing points where multiple entry reasons overlap..
Also included is a method for exploring upside and downside targets using the three-line RCI.
In the PDF explanations,there are more than 1,350 charts..

× ![]()


