

[RCI3 Three-Line + mBDSR] USD/JPY 5-minute chart Retracement Sell Signal 20181227
0
Campaign is ongoing until January 10, 2019.
BODSOR (mBDSR)sales page ishere.
BODSOR and mBDSR are indicators developed to improve entry accuracy when using a three-line RCI (RCI 3-line) for buy-the-dip or sell-the-rally strategies.
The figure below is a 5-minute USD/JPY chart.
USD/JPY 5-minute chart (December 27, 2018)
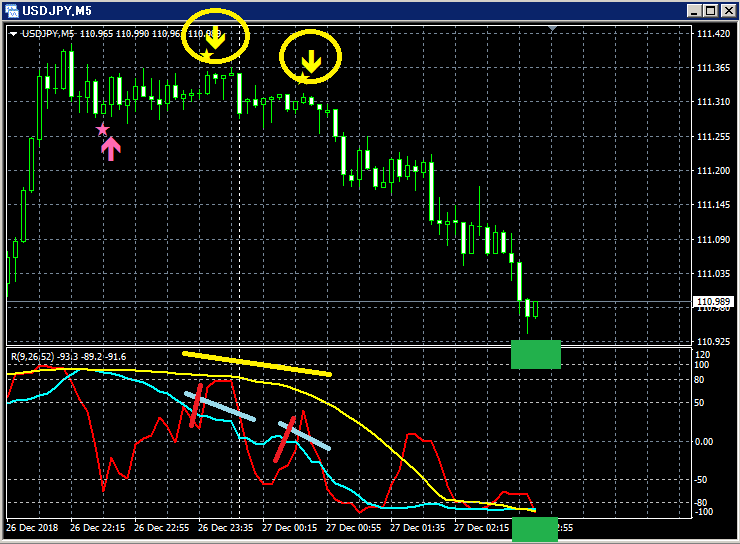
Top: mBDSR
Of the three RCI lines, only RCI9 is clearly rising.
If RCI9 reverses downward, all three RCI lines may start to fall together in this situation.
In other words, price could undergo a strong drop.
In such a scenario,mBDSR’s pullback/sell signal (yellow arrows circled) lights up twice.
.
In this example, the sell signal appears to accurately capture the timing of the decline resuming
and is thus effective.
As a result, the price drops to what is known as the triple-bottom of RCI.
BODSOR (mBDSR) sales page ishere.

Twitter
https://twitter.com/RCIX3Line
Blog
http://bodsor.blog.fc2.com/
Investment Navigator+
https://fx-on.com/navi/serial/?id=359
YouTube
https://www.youtube.com/channel/UCL-g5uAlesiWVJEDtWlFvGw
Examples of buy-the-dip and sell-the-rally signals on the USD/JPY 1-hour chart
※In the charts in this article, for convenience of explanation, circles, lines, rectangles, and other marks may be drawn.
Please understand.
× ![]()


