

Canadian Dollar/Japanese Yen 1-Hour Timeframe Pullback Buy Signal [RCI 3-Line + mBDSR] 20181227
※Campaign is ongoing until January 10, 2019.
BODSOR (mBDSR) sales page ishere.
※ BODSOR and mBDSR are indicators developed to improve the entry precision when using three RCIs to buy on dips or sell on rallies.
The figure below is the 1-hour chart of USD/JPY.
USD/JPY 1-hour chart (December 20–27, 2018)
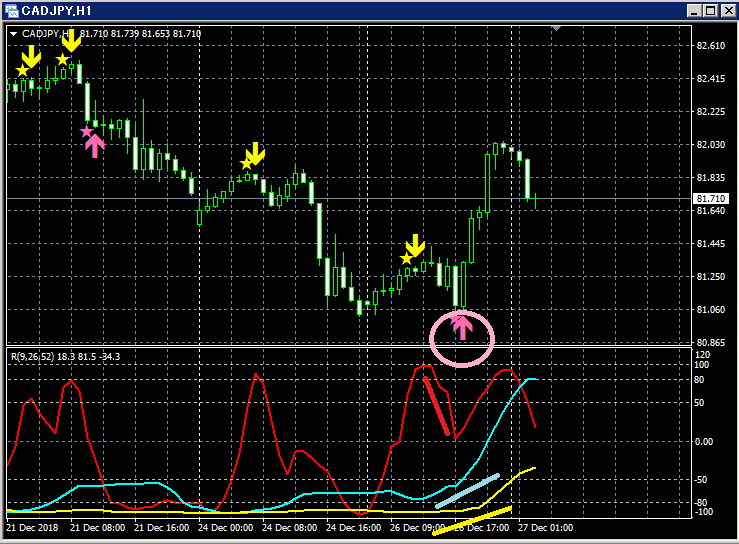
Upper panel: mBDSR
Lower panel: three RCI lines (red: RCI9, light blue: RCI26, yellow: RCI52)If RCI9 reverses and begins to rise, all three RCIs may rise together.
In other words, prices may rise strongly.
In such a situation,mBDSR’s dip-buy signal (pink arrow circled) lights up.
Right after the signal lights, five bullish candles appear consecutively, and thereafter the price continues to rise smoothly.
This is evident.
In this example, the reversal and rise of the declining RCI9 is confirmed after the bullish candles appear following the signal.
BODSOR (mBDSR) sales page ishere.

Twitter
https://twitter.com/RCIX3Line
Blog
http://bodsor.blog.fc2.com/
Investment Navi+
https://fx-on.com/navi/serial/?id=359
YouTube
https://www.youtube.com/channel/UCL-g5uAlesiWVJEDtWlFvGw
Examples of dip-buy and pullback-sell signals on USD/JPY 1-hour chart
※ The charts in this article may have added circles, lines, or boxes for convenience of explanation, so please understand.
× ![]()


